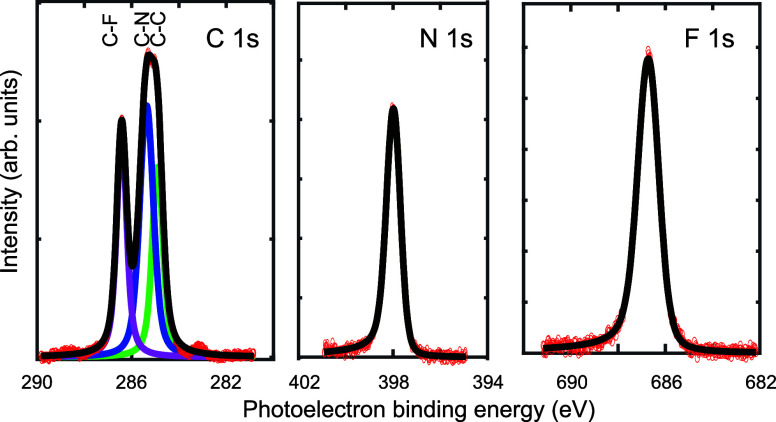
Figure 3.
C 1s, N 1s, and F 1s SXP spectra recorded for the ordered overlayer of F4TCNQ on Ag(111). Individual data points are shown in red, while the overall fit is shown as a black line. The C 1s spectrum shows the three chemically shifted components associated with C–F (red), C–N (blue), and C–C (green) local environments. The photon energies used were 435 eV (C 1s), 550 eV (N 1s), and 850 eV (F 1s). Binding energies are relative to the Fermi edge measured at the same photon energies.

