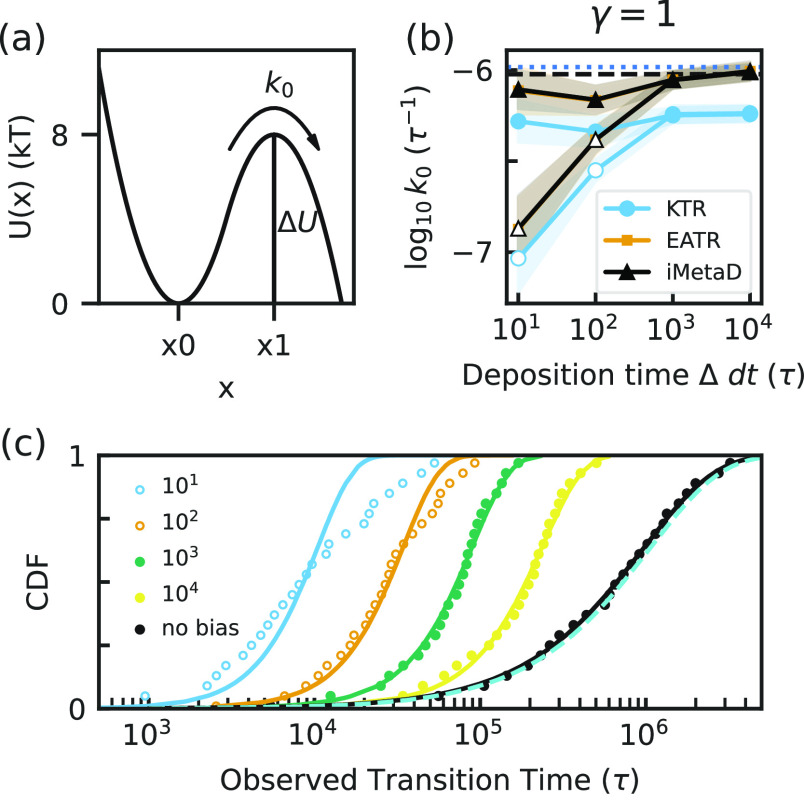
Figure 1.
(a) The potential energy profile of the 1D matched-harmonic potential from eq 23. (b) The unbiased rate constant from Kramers’ rate theory and from unbiased simulations are shown as the dashed black line and the dotted blue line, respectively. We compare these with predictions from iMetaD, and from the KTR and EATR methods by asserting γ = 1 as a function of the bias-deposition time (Δdt). Maximum likelihood estimates are represented by open symbols while CDF-fit estimates are filled symbols. Error bars are from a bootstrap analysis as described in Section 5.5. (c) The empirical CDFs of observed transition times over the barrier are shown with their EATR-CDF fits; different bias deposition times are indicated in the caption with curves with fastest to slowest biasing appearing from left to right. Fits that fail the KS test are represented with open symbols. The unbiased empirical CDF (black points) is shown together with the Poisson-process distribution fit (black line) and the predicted distribution using the Kramers’ analytical expression, eq 24 (cyan dashed line).

