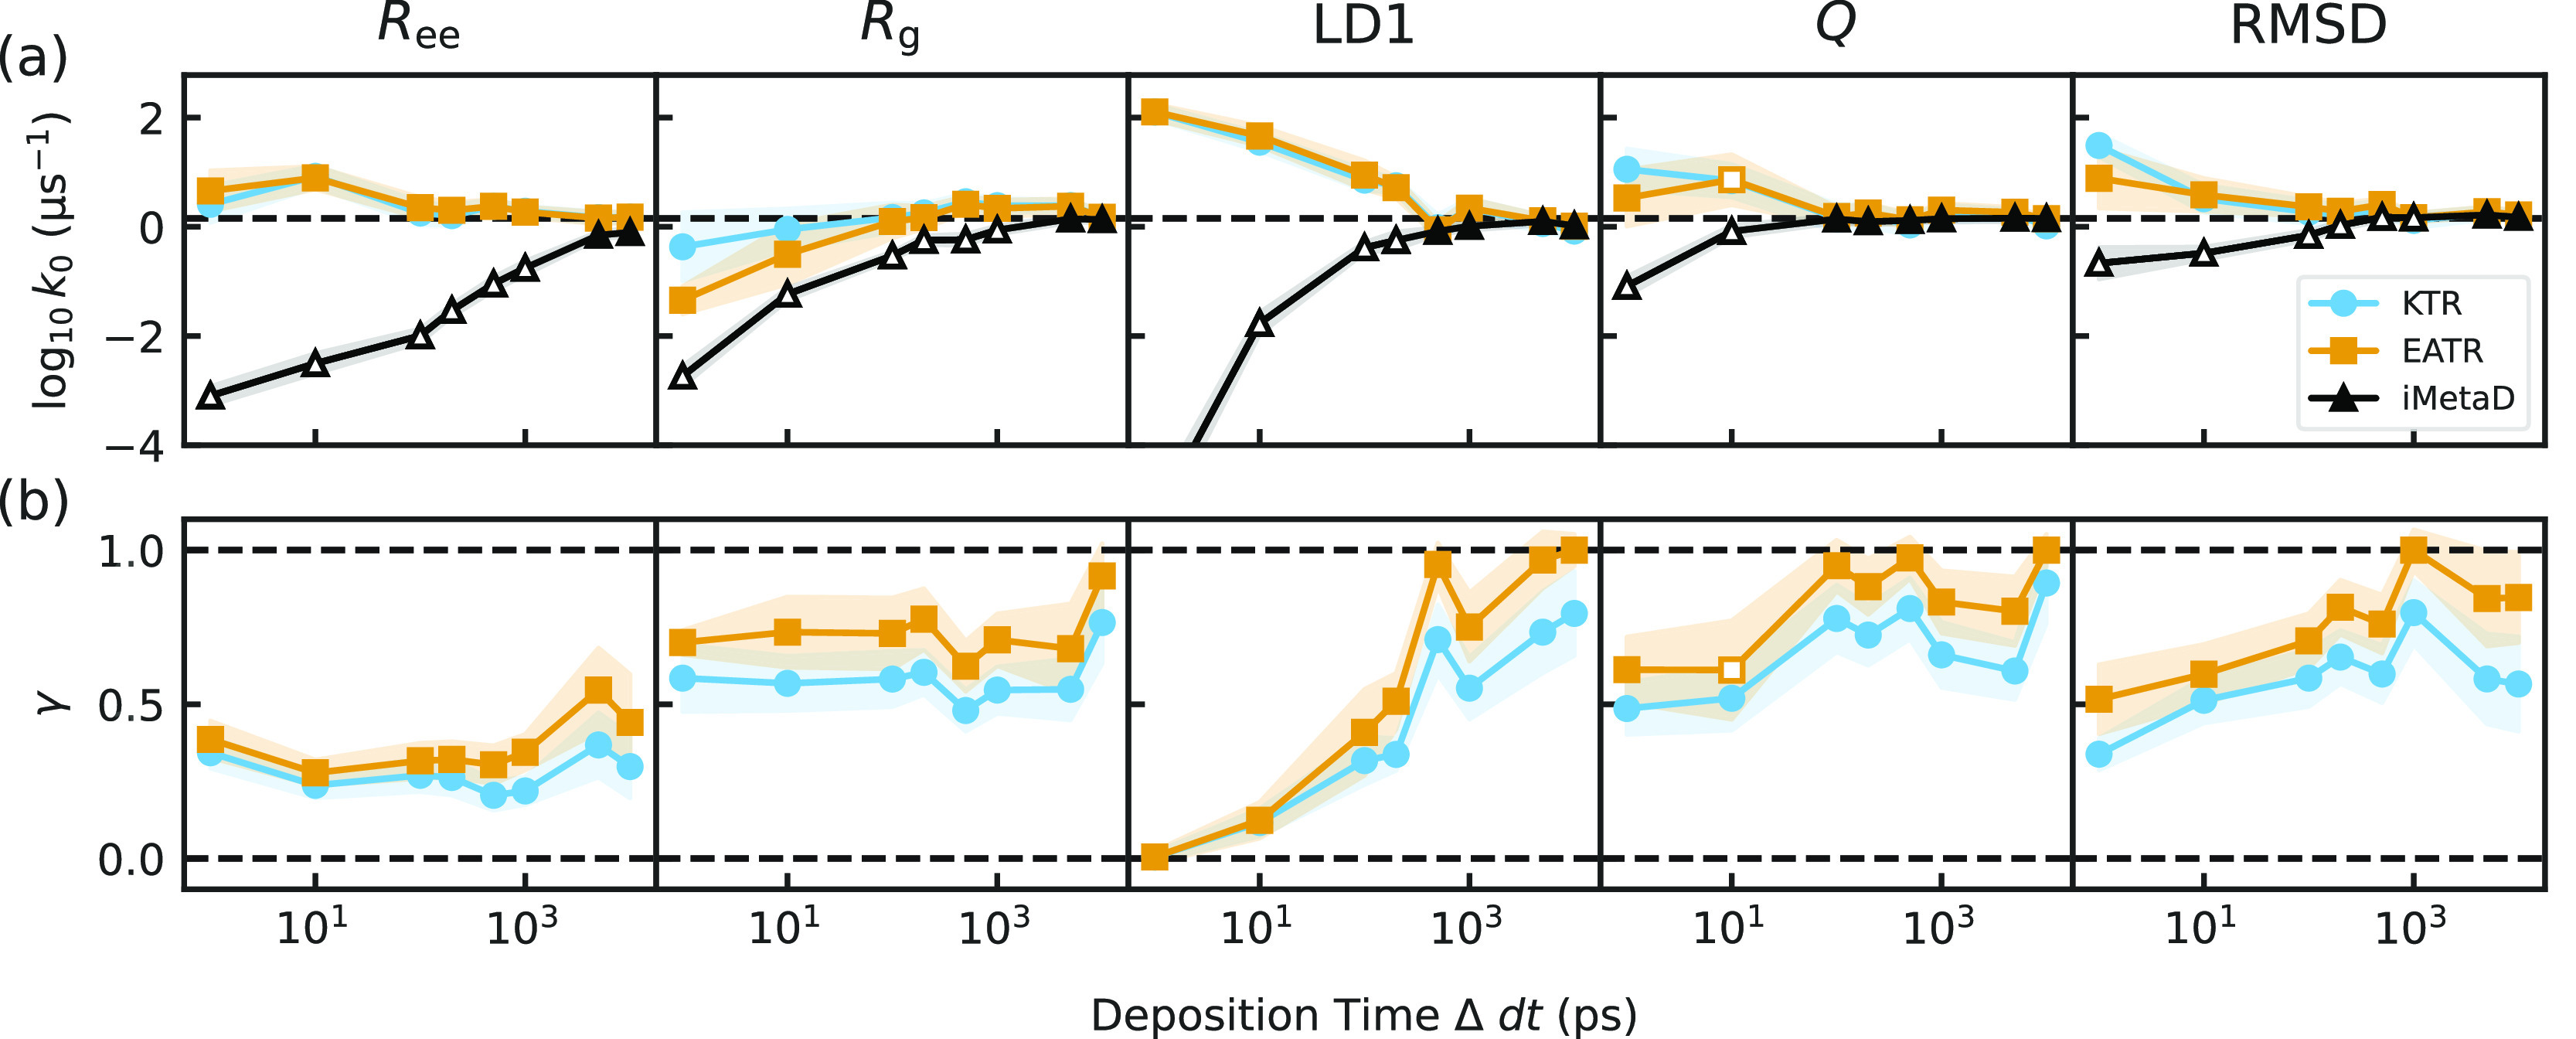
Figure 3.

(a) The rate constants obtained from fitting the CDF for iMetaD (black), KTR (blue), and EATR (orange) for each CV at various deposition times (Δdt). The horizontal dashed line represents the empirical rate obtained from unbiased simulations. Open shapes indicate where the KS test failed. (b) γ values obtained for the KTR and EATR methods. Horizontal dashed lines represent the bounds placed on γ. In both panels, the error bars are computed from a bootstrap analysis as described in Section 5.5.
