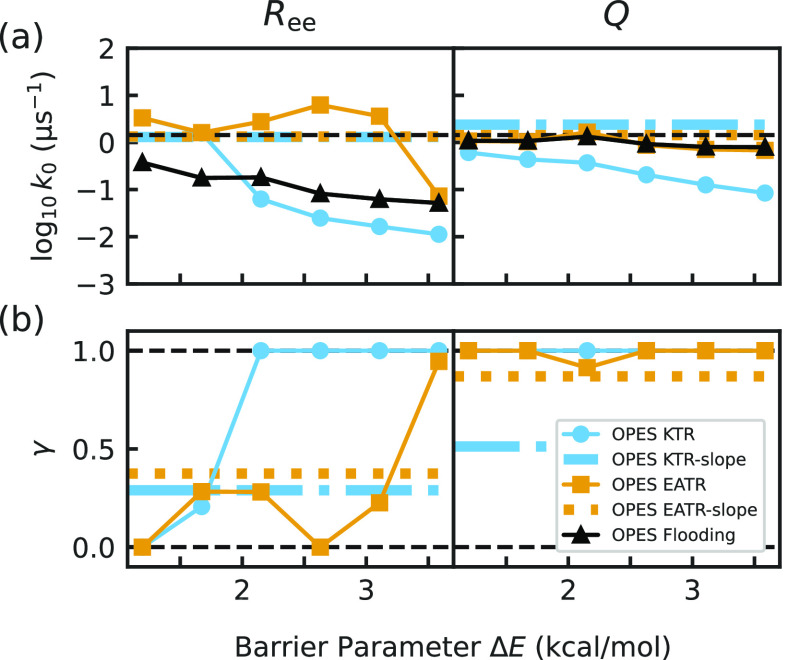
Figure 5.
(a) The rate constant estimates obtained from applying the iMetaD, KTR, and EATR methods to OPES simulations when biasing Ree (left) or Q (right), varying the OPES barrier parameter. (b) The values of γ obtained from these KTR and EATR fits. Colored horizontal dashed lines in both panels represent the more accurate estimates obtained from fitting the observed OPES unfolding rate constant and γ as described in Section S9, denoted OPES-EATR-slope or OPES-KTR-slope, using different OPES barrier simulations; see Figure S7.

