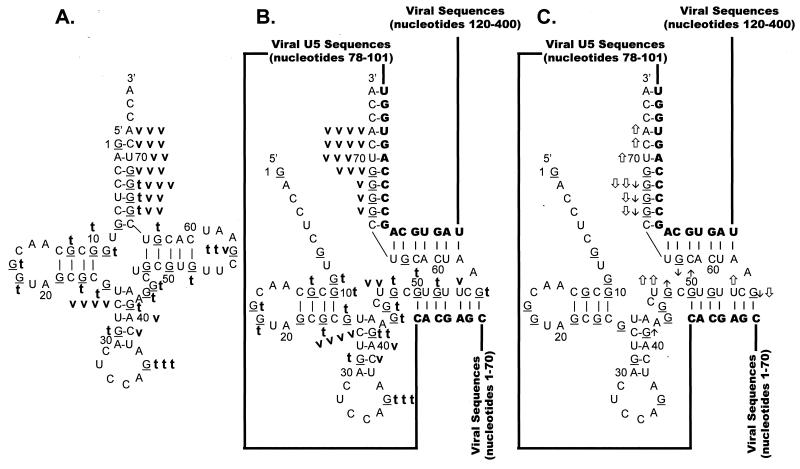
FIG. 8.
Summary of nuclease digestion data for tRNATrp. Secondary-structure diagrams for tRNATrp in the presence and absence of WT viral RNA fragments are depicted. The structure in panel A was adapted from reference 28. The structures in panels B and C are derived from the structure in panel A and the limited nuclease digestion data in Fig. 7. G residues (target of T1 nuclease) of the tRNA are underlined. Nucleotide sequences are numbered every 10 bases from the 5′ end of tRNATrp. Viral RNA sequences base paired to the tRNATrp are shown in bold capital letters, while viral sequences not involved in base pairing interactions are represented as lines. (A) Digestion of tRNATrp. A bold lowercase t indicates T1 cleavages, where t t t was the strongest cleavage site seen with 0.007 U of T1 per μl, t t was a moderate cleavage seen with 0.007 U/μl, and t was a moderate cleavage seen with 0.002 U/μl. A bold lowercase v indicates V1 cleavages, where v v v indicates moderate cleavages seen with 1 × 10⁻⁵ U of V1 per μl, v v indicates moderate cleavages seen with 3 × 10⁻⁴ U/μl, and v indicates moderate cleavages with 1 × 10⁻⁴ U/μl. (B) Digestion of tRNATrp annealed to WT RSV RNAs. Description of T1 cleavages is in panel A. Description of V1 cleavages is in panel A, except that v v v v indicates strong cleavages with 1 × 10⁻⁵ U/μl. (C) Changes in digestion pattern when tRNATrp was annealed to WT RSV RNAs. Description of changes is as in the legend to Fig. 3C.

