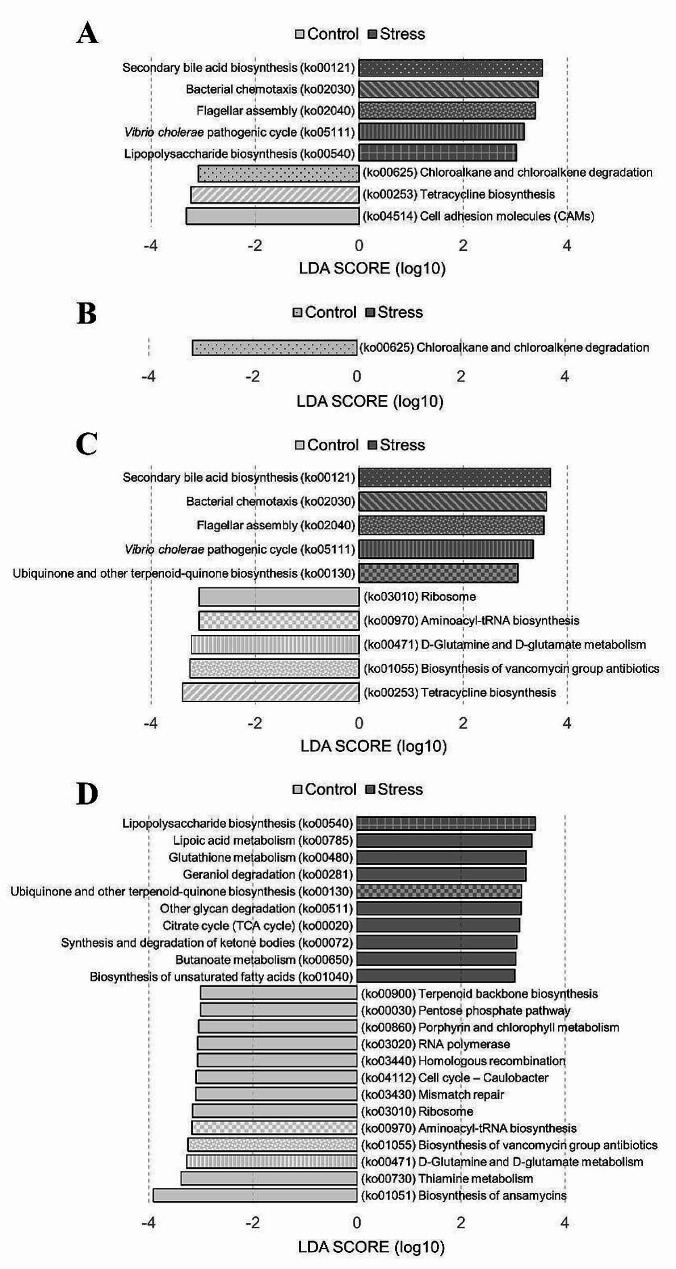
Fig. 7.
LEfSe showing functional biomarkers that differed in abundance between Control and Stress groups. Identification of predicted gut microbiota functions that differentiated the two groups for (A) all time points, (B) T06, (C) T12, and (D) T24 by LDA effect size. The pattern-coded bars represent functions that reoccur at different time points. The functional biomarkers (here with annotation at the KEGG 3 level) corresponded to the predicted microbial pathways in Table S3. The differences were significant (p < 0.05) among classes (Kruskal-Wallis test). The threshold value of the logarithmic LDA score was 3.0

