Figure 4.

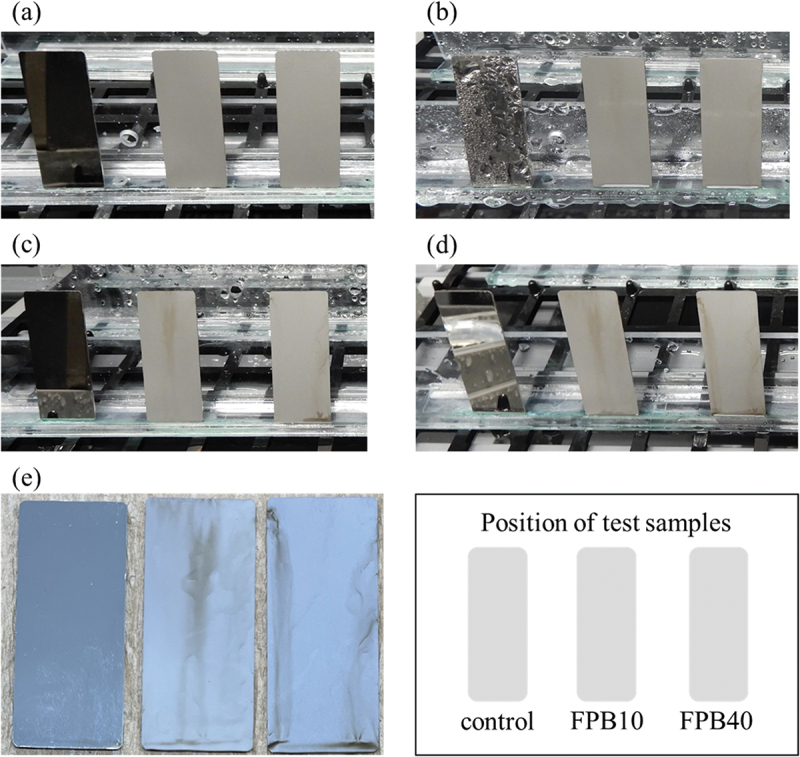
Appearance of samples with salt spray test time. (a) 0 h, (b) 24 h, (c) 48 h, (d) 72 h, and (e) 96 h. Samples position are as shown in the illustration.

Appearance of samples with salt spray test time. (a) 0 h, (b) 24 h, (c) 48 h, (d) 72 h, and (e) 96 h. Samples position are as shown in the illustration.