Figure 9.

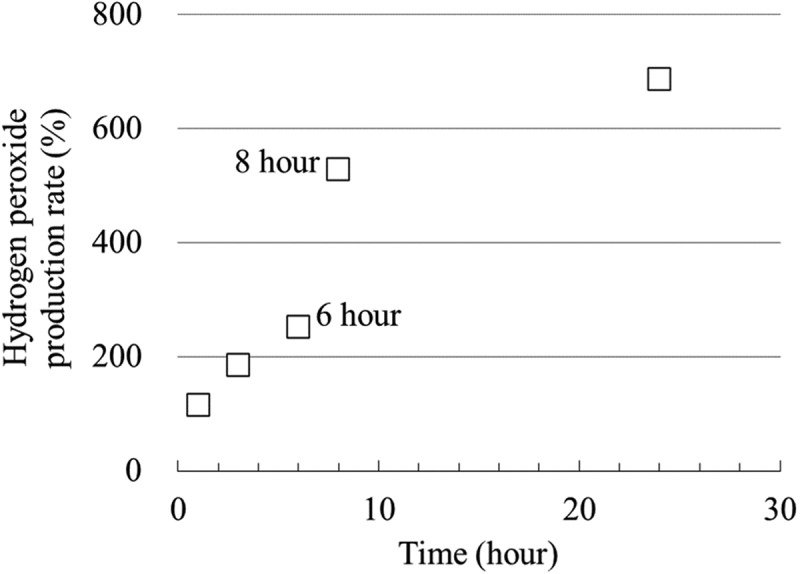
Rate of increase in hydrogen peroxide production per test time on the FPB10-treated surface relative to that on the control surface.

Rate of increase in hydrogen peroxide production per test time on the FPB10-treated surface relative to that on the control surface.