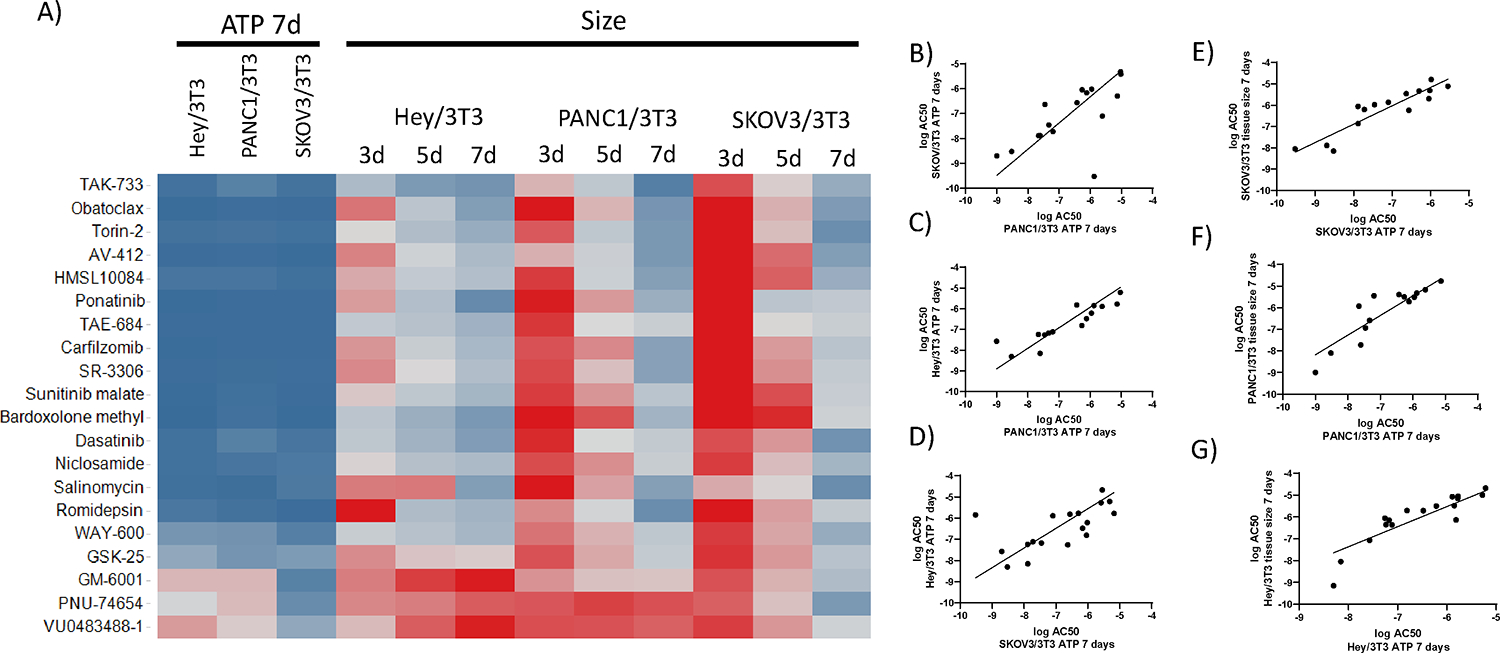
Figure 3.

Comparison of pharmacological effects of compounds on 3D heterotypic multicellular tumor spheroids of different cancer types. A) The heat map illustrates size-based % maximal responses at 20 μM drug concentrations calculated over time from HEY/NIH, PANC/NIH and SKOV/NIH microtissues. Darkest red indicates 100 % growth for tissue size data. Darkest blue indicates 0 % growth for tissue size data. For % maximal response calculations tissue size values were normalized to the vehicle control. Correlation plots of logAC50 between different tumor microtissue types using ATP 7 days as a readout (B-D), and between ATP and tissue size at 7 days, for each cancer microtissues (E-G).
