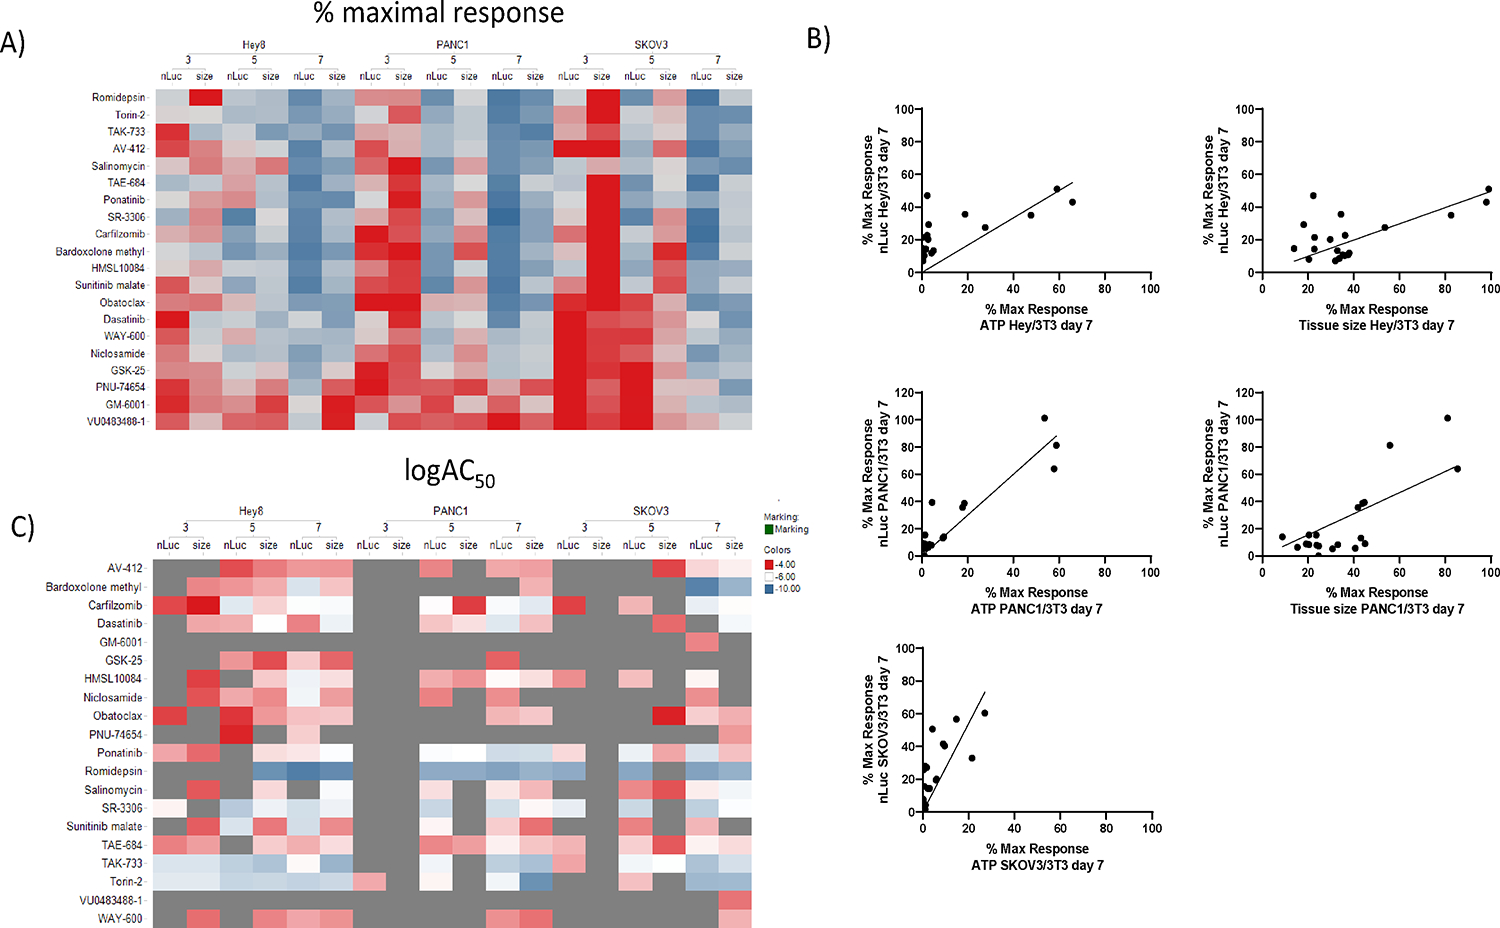
Figure 4.

Comparison of pharmacological effects of compounds on NanoLUC reporter from fibroblasts cells and spheroid size on 3D heterotypic multicellular tumor spheroids of different cancer types. A) The heat map illustrates % maximal responses at 20 μM drug concentrations calculated based on tissue size and NanoLUC luminescence measurements over time for HEY/NIH, PANC/NIH and SKOV/NIH microtissues. Darkest red for tissue size indicates 100 % size of the entire microtissue, and for NanoLUC data it indicates 100 % viability of the fibroblasts within the microtissue. Darkest blue for tissue size data indicates 0 % tissue and for NanoLUC data it indicates 0 % viability of the fibroblasts within the microtissue. B) Correlation plots of % maximal responses between NanoLuc and tissue size readouts in the same cancer tissues, and the same readouts across different cancer microtissues. C) Heat map a heat map comparing the logAC50 values calculated from doses responses based on tissue size and NanoLUC luminescence measurements over time for HEY/NIH, PANC/NIH and SKOV/NIH microtissues. Those conditions for which a compound had no efficacy and IC50 could be calculated are indicated in grey.
