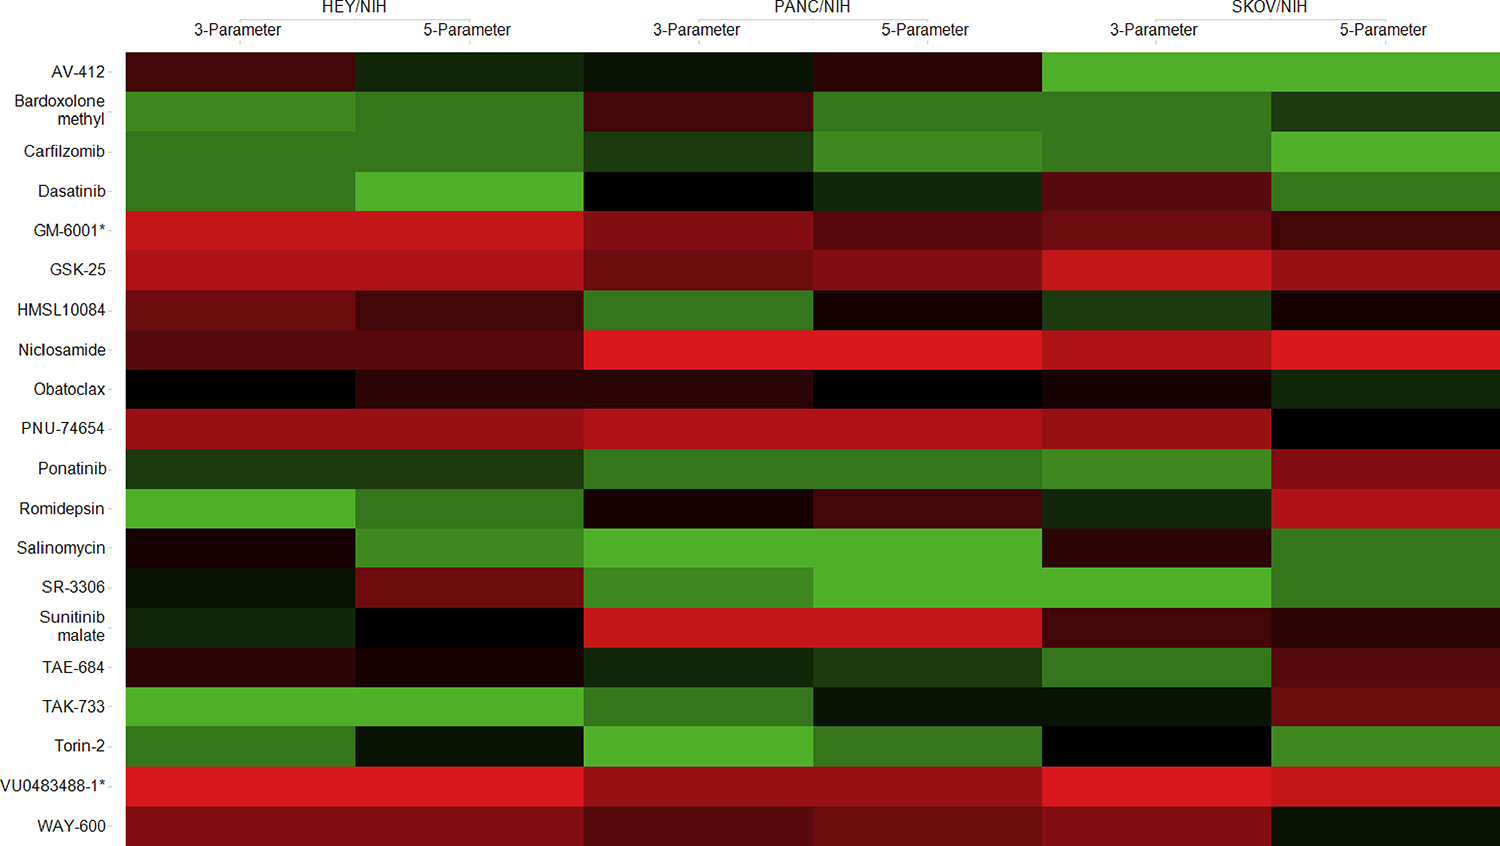
Figure 5.

Heat map based on rank changes of the individual compounds between 3- and 5-parameter classifications. Colored by ranking score: 1 (green) corresponds to the best therapeutic window, and 20 (red) corresponds to the smallest therapeutic window.
