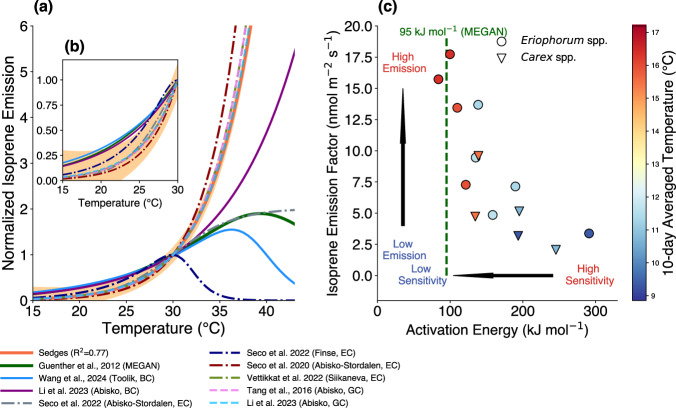
Fig. 1. Isoprene temperature sensitivities from sedges and other measurements.
a presents the temperature responses of isoprene emissions from this and previous studies in the northern high-latitude regions. (b) is the same plot as (a), but only for temperatures under 30 °C; (c) shows the relationship between the isoprene temperature sensitivities and emission capacities of sedges. (a) The short-term temperature response curves of sedges up to 35 °C from this study are shown by the orange solid line, and the orange shading represents the 95% confidence intervals. The short-term temperature response curves of tundra ecosystem from previous studies are also presented by lines with different colors and patterns. GC, BC and EC represent ground chamber experiments, branch chamber experiments and eddy-covariance measurements. The temperature response curves are normalized to the emission level when the leaf temperature equals 30 °C. The temperature curves in Tang, et al. 29. and Li, et al.25. came from the ground chamber observations of mixed local vegetation at the Abisko site. Li, et al.25. also did the branch chamber experiments for Salix myrsinites L. (purple solid line). The site in Seco, et al.21 is located in a sedge-dominated fen near the Abisko-Stordalen site. The Abisko measurements in Seco, et al. 24. happened at a different location within the same Abisko-Stordalen area on an ombrotrophic permafrost plateau. The Finse site in Seco, et al.24. is a tundra with a mixture of fen and heath vegetation with shrubs and lichens. The Siikaneva site is in a fen dominated by moss, sedges and dwarf shrubs, and surrounded by Scots pine forest26. c presents an inverse relationship between the activation energies of the isoprene temperature response and the isoprene emission factors for Eriophorum spp. (circle) and Carex spp. (triangle). The green dashed line in (c) shows the activation energy in the Model of Emissions of Gases and Aerosols from Nature (MEGAN)13. The colors of markers denote the average temperatures over the previous 10 days, and the emission factor is defined as the level of isoprene emission at a leaf temperature of 30 °C and a photosynthetic photon flux density (PPFD) of 1000 μmol m−2 s−1.

