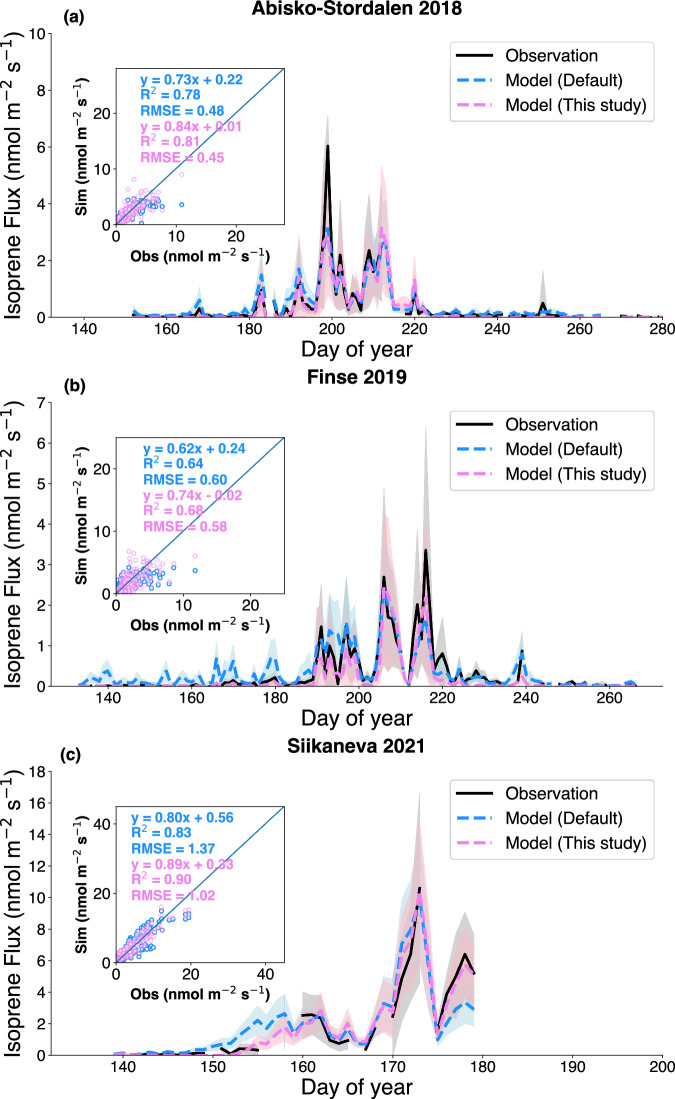
Fig. 2. Time series of the daily observed and simulated isoprene flux by MEGAN with the default (blue) and updated (pink) temperature responses.
The eddy-covariance flux measurements (black line) from three high-latitude sites, Abisko-Stordalen site in 201824 (a), Finse site in 201924 (b) and the Siikaneva site in 202126 (c), were evaluated. The shaded areas in different colors represent the standard deviation of the daily fluxes from observations (gray), the default MEGAN (blue), and the updated MEGAN (pink), respectively. The scatter plots illustrate the performance of the models compared to half-hourly isoprene flux measurements. Isoprene measurements with a photosynthetic photon flux density exceeding 300 µmol m-2 s-1 were taken for comparison. The updated model incorporates Arctic grass and boreal shrub temperature response curves, while the default model uses the temperature curves in MEGAN v2.113.

