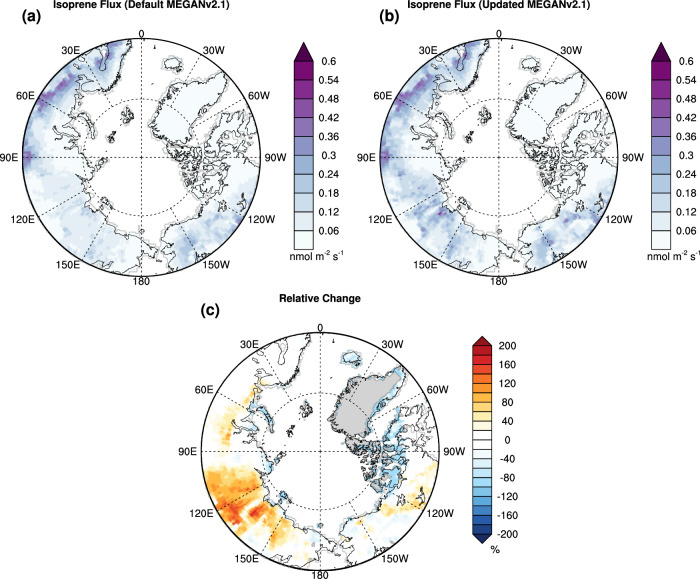
Fig. 3. The averaged isoprene emissions in high-latitude regions (north of 60°N) during 2000–2009 estimated by MEGAN.
The default MEGAN (a) and the updated MEGAN (b) were driven by the CLM5 model. The relative change caused by the updated temperature response curves is presented in (c). The averaged isoprene emissions estimated by the updated model are 3.25 Tg yr−1, around 20 % higher than the original MEGAN estimate of 2.71 Tg yr−1.

