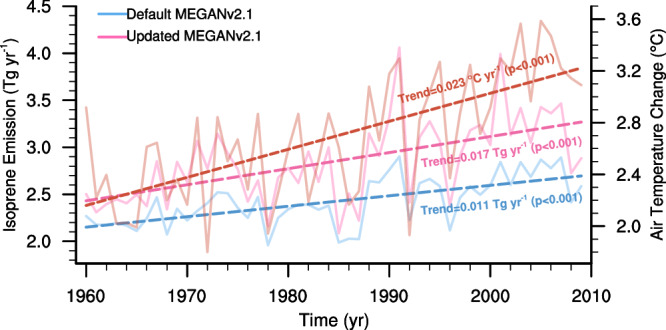
Fig. 4. Long-term trend of isoprene emission in high-latitude regions (north of 60°N) estimated by MEGAN during 1960–2009.

Time series of isoprene emissions, as estimated by the default MEGAN and the updated MEGAN, are depicted by the blue and pink solid lines, respectively. Changes in air temperature over land are shown by the orange solid line. The linear trends of isoprene emissions, as estimated by the default MEGAN and the updated MEGANv2.1, are indicated by the blue and pink dashed lines, respectively. The linear trend of air temperature over land is represented by the orange dashed line. The significance of the linear trends for isoprene emissions and air temperature was tested using the Mann-Kendall test. For high latitude regions (north of 60°N), the linear trends in isoprene emissions are estimated to be 0.017 Tg yr−1 (p < 0.001) for the updated MEGANv2.1 and 0.011 Tg yr-1 (p < 0.001) for the default MEGANv2.1.
