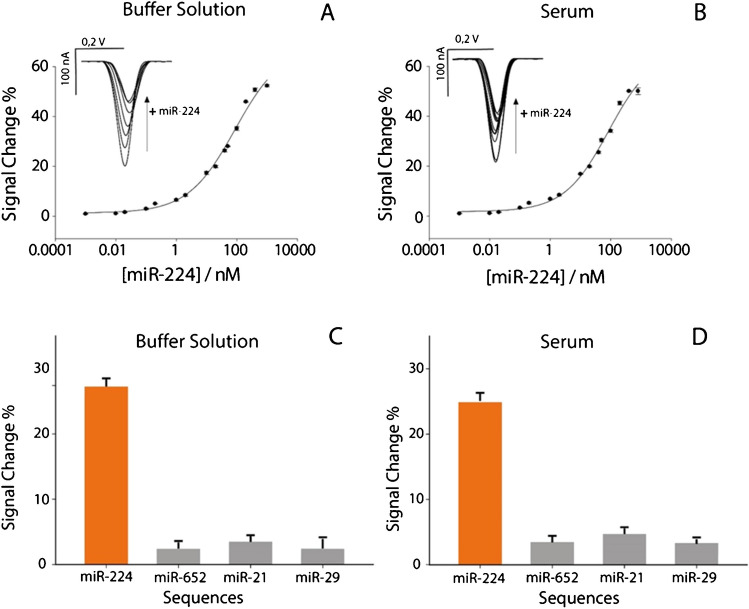
Fig. 2.
A Calibration curve and SWV curves obtained in buffer solution by testing different concentrations of miR-224 target from 0.01 to 800 nM. B Calibration curve and SWV curves obtained in human serum by testing different concentrations of miR-224 from 0.01 to 800 nM. All the experiments have been carried out in triplicate. SWV parameters were as follows: t eq = 5 s, E start = 0.0 V, E end = − 0.6 V, E step = 0.001 V, amplitude = 0.01 V, frequency = 50.0 Hz. Selectivity studies comparing signal intensities obtained in the presence of 50 nM miR-224 and in the presence of noncomplementary miRNA single strands, in C buffer solution and D human serum

