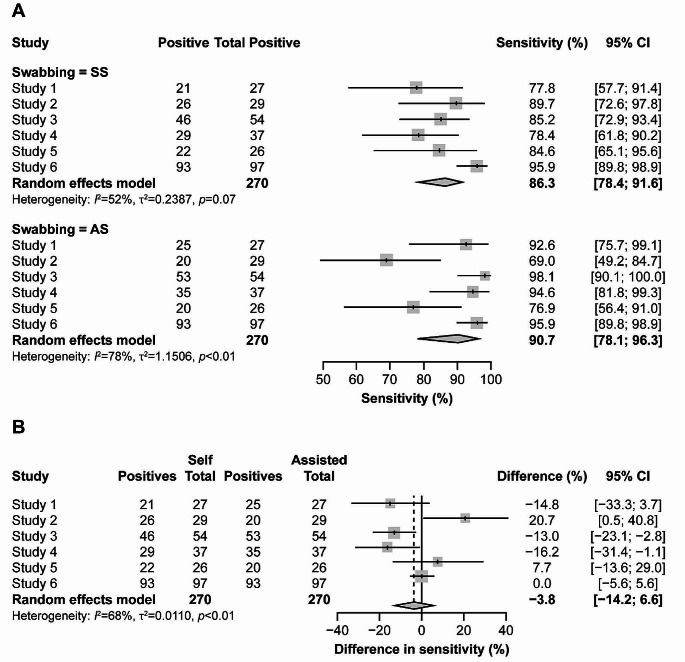
Fig. 2.
Forest plot comparing sensitivity in SARS-CoV-2 detection between SS and AS (a) Sensitivity of SS and AS across the six studies. (b) Differences in sensitivity between SS and AS. 95% CI of single studies are shown as horizontal lines. Diamond indicates pooled estimate with left and right sides corresponding to lower and upper 95% CI. Dashed line indicates pooled difference in sensitivity. AS, assisted swabbing; CI, confidence interval; SARS-CoV-2, severe acute respiratory syndrome coronavirus 2; SS, self-swabbing

