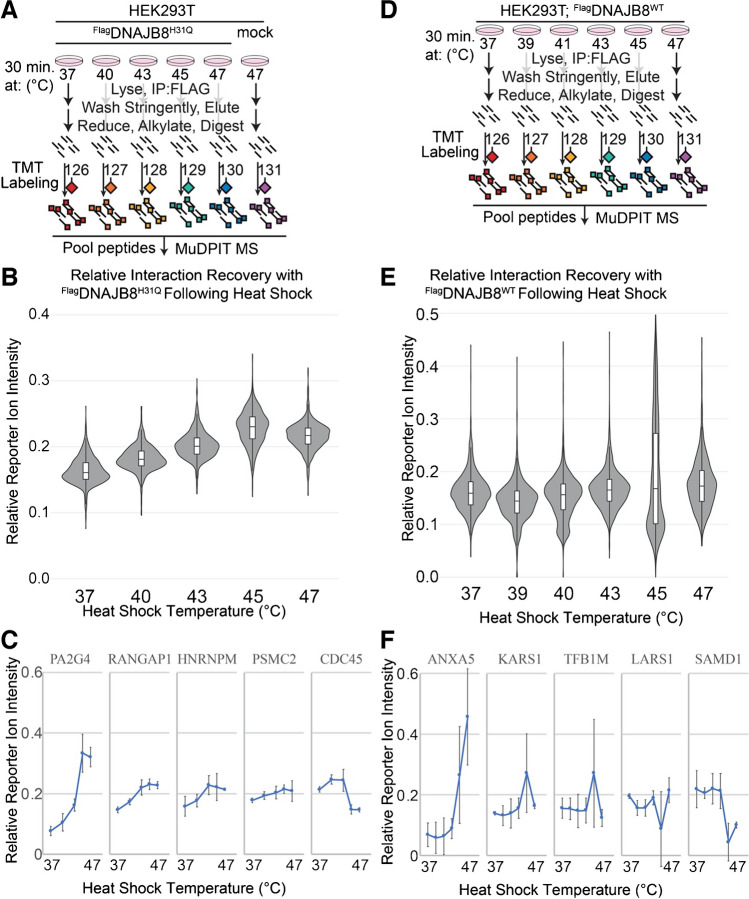
Fig. 6.
A Schematic describing the experiment profiling DNAJB8H31Q affinity following heat shock. B Violin and bar plots for all quantified interacting proteins (n = 989). C Changes in reporter ion intensity for proteins with the highest, 25%, median, 75%, and lowest response with respect to temperature. Error bars represent standard deviation (n = 3). D Schematic describing the experiment profiling DNAJB8WT affinity following heat shock. E Violin and bar plots for all quantified interacting proteins (n = 1541). F Changes in reporter ion intensity for proteins with the highest, 25%, median, 75%, and lowest response with respect to temperature. Error bars represent standard deviation (n = 3)

