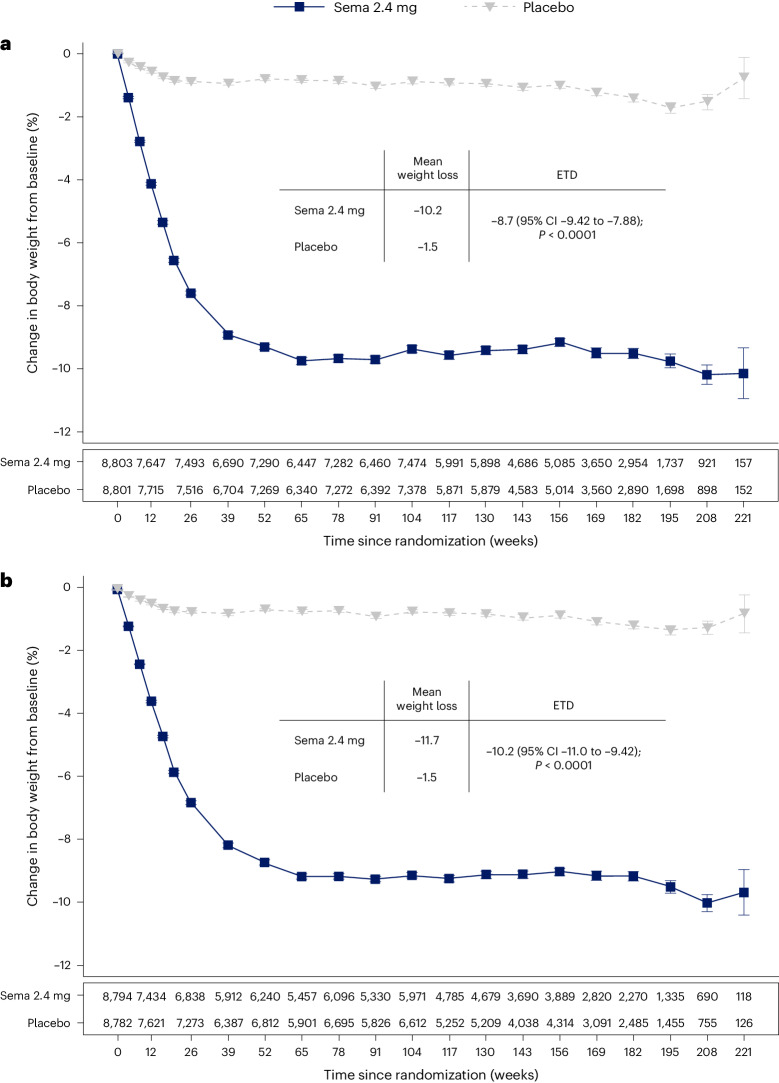
Fig. 1. Percentage change in mean body weight from baseline through week 208 for all patients in-trial21 and first on-treatment.
a,b, Observed data from the in-trial period (a) and first on-treatment (b). The symbols are the observed means, and error bars are ±s.e.m. Numbers shown below each panel represent the number of patients contributing to the means. Analysis of covariance with treatment and baseline values was used to estimate the treatment difference. Exact P values are 1.323762 × 10−94 and 9.80035 × 10−100 for a and b, respectively. P values are two-sided and are not adjusted for multiplicity. ETD, estimated treatment difference; sema, semaglutide.

