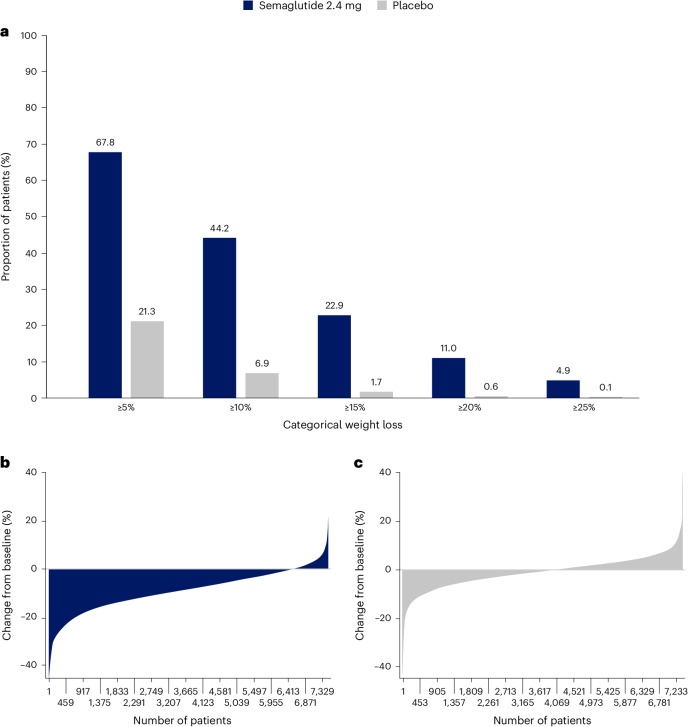
Fig. 2. Variation in weight loss response for semaglutide andplacebo.
a, Categorical weight loss from baseline at week 104 for semaglutide and placebo. Data from the in-trial period. Bars depict the proportion (%) of patients receiving semaglutide or placebo who achieved ≥5%, ≥10%, ≥15%, ≥20% and ≥25% weight loss. b,c, Percentage change in body weight for individual patients from baseline to week 104 for semaglutide (b) and placebo (c). Each patient’s percentage change in body weight is plotted as a single bar.

