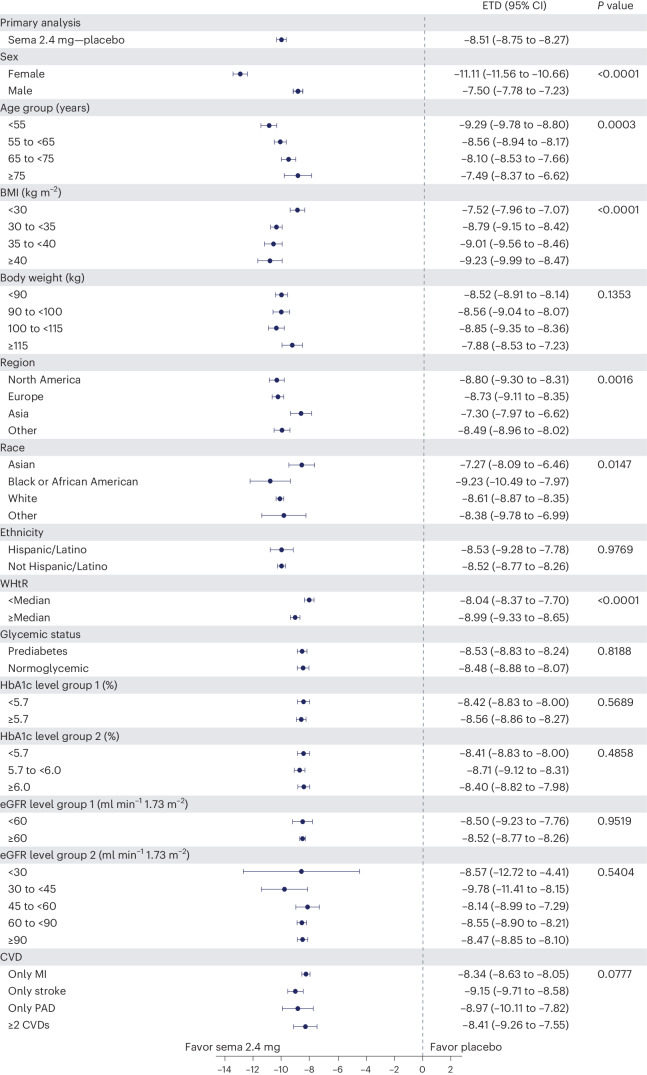
Fig. 5. Effect of semaglutide treatment or placebo on mean percentage change in body weight from baseline to week 104 by subgroups.
Data from the in-trial period. N = 17,604. P values represent test of no interaction effect. P values are two-sided and are not adjusted for multiplicity. The dots show estimated treatment differences, and the error bars show 95% CIs. Details of the statistical models are available in Methods. ETD, estimated treatment difference; HbA1c, glycated hemoglobin; MI, myocardial infarction; PAD, peripheral artery disease; sema, semaglutide.

