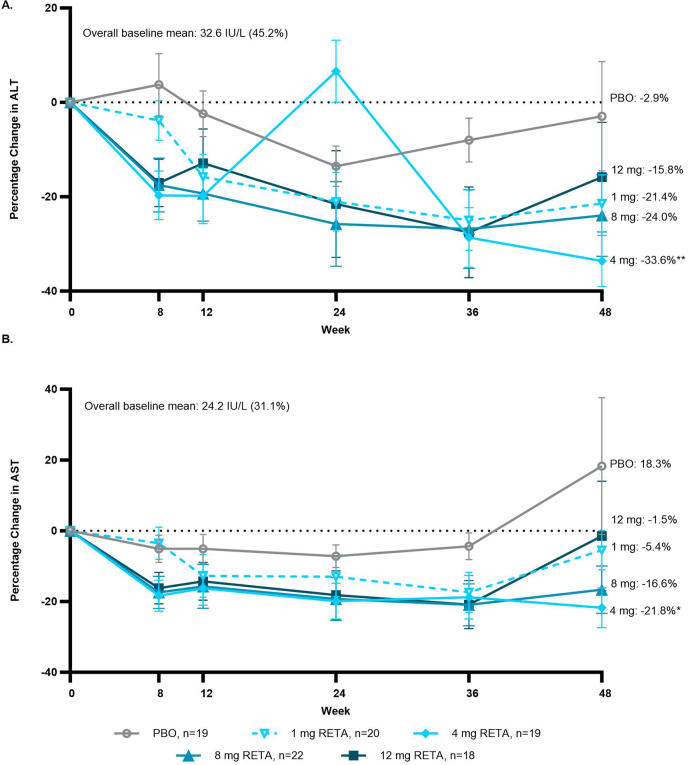
Extended Data Fig. 7. Percent change from baseline - ALT and AST.
a, The percentage change from baseline in ALT. b, The percentage change from baseline in AST with results shown graphically as LS means ± 1.96 × SE; Baseline as geometric mean (Coefficient of variation%). Comparisons vs. PBO were done by using 2-sided z-tests without multiplicity adjustment. ALT=alanine aminotransferase; AST=aspartate aminotransferase; LS=least squares; PBO=placebo; RETA= retatrutide; SE=standard error.

