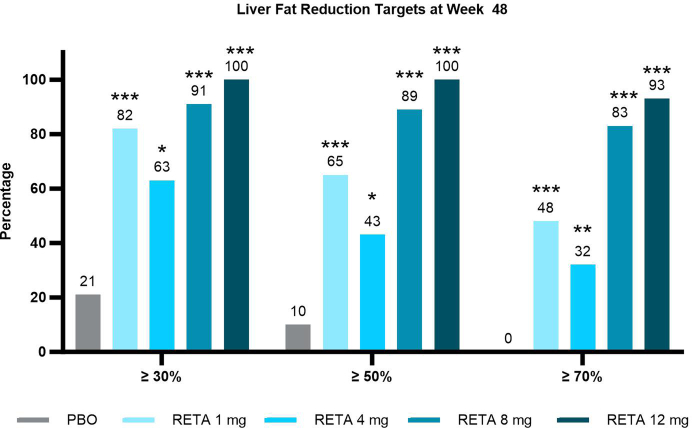
Extended Data Fig. 3. Percent of participants achieving liver fat reduction targets at week 48.
Results shown as LS means ± SE. Comparisons vs. PBO were done by using 2-sided z-tests without multiplicity adjustment. Fewer participants had MRIs at Week 48 (n=8 [PBO], n=9 [1 mg RETA], n=9 [4 mg RETA], n=8 [8 mg RETA], n=9 [12 mg RETA]) compared with Week 24 (n=14 [PBO], n=16 [1 mg RETA], n=15 [4 mg RETA], n=17 [8 mg RETA], n=15 [12 mg RETA]). MRI, magnetic resonance imaging; PBO, placebo; RETA, retatrutide.

