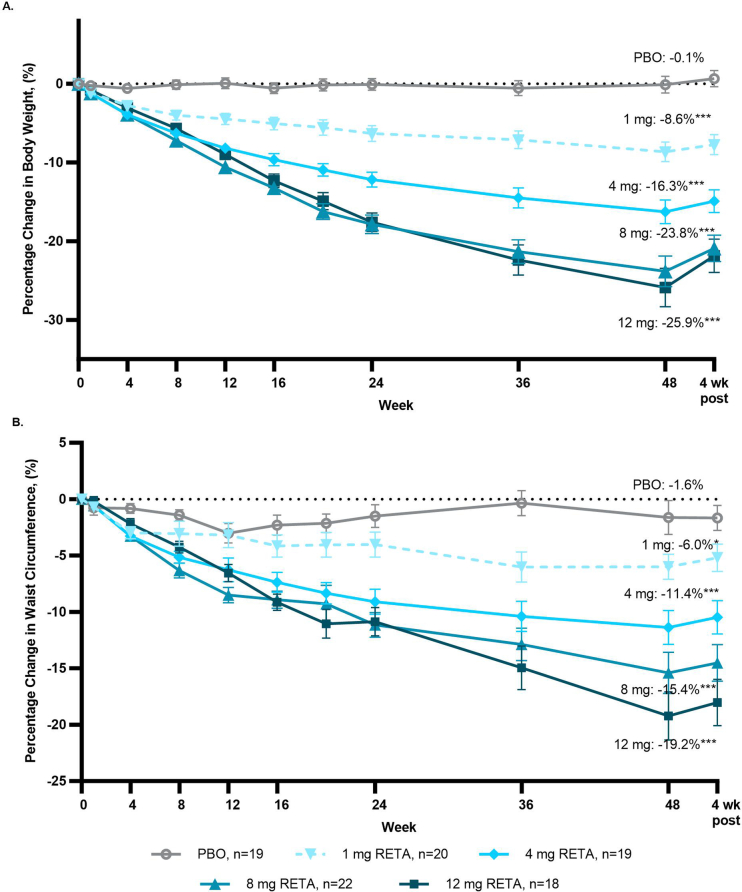
Extended Data Fig. 5. Percentage change in body weight and waist circumference.
a, The percentage change in body weight. b, The percentage change in waist circumference with results shown as LS means (SE). Comparisons vs. PBO were done by using 2-sided z-tests without multiplicity adjustment. *p<0.05 vs. PBO; **p<0.01; ***p<0.001 vs. PBO. Results at the 48-week end-of-treatment visit are shown with statistical testing results. Additionally, 4-week post-treatment results are shown. LS, least squares; PBO, placebo; RETA, retatrutide; SE, standard error.

