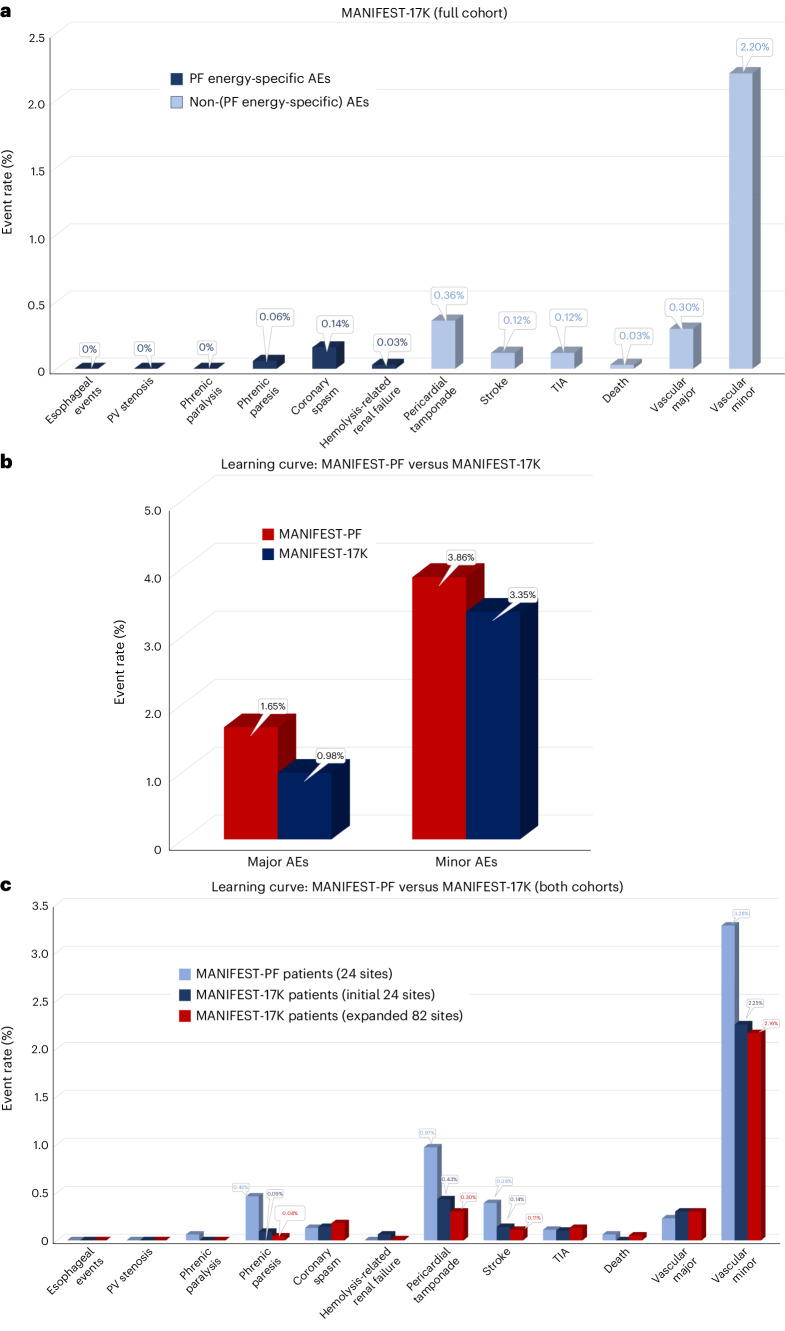
Fig. 2. Complication rates.
a, Shown are the rates of complications, partitioned by relationship to pulsed field energy. Dark blue, complications with some degree of specificity to the energy source; light blue, complications that are more general to catheter ablation procedures. b, Shown are aggregated major and minor AE rates as initially reported in the MANIFEST-PF cohort (n = 1,758 patients; red bars) and observed in the currently studied MANIFEST-17K cohort (n = 17,642 patients; blue bars). c, Shown is a comparison of complication rates between those observed in the MANIFEST-PF cohort (light blue) as compared to both subcohorts of MANIFEST-17K. TIA, transient ischemic attack.

