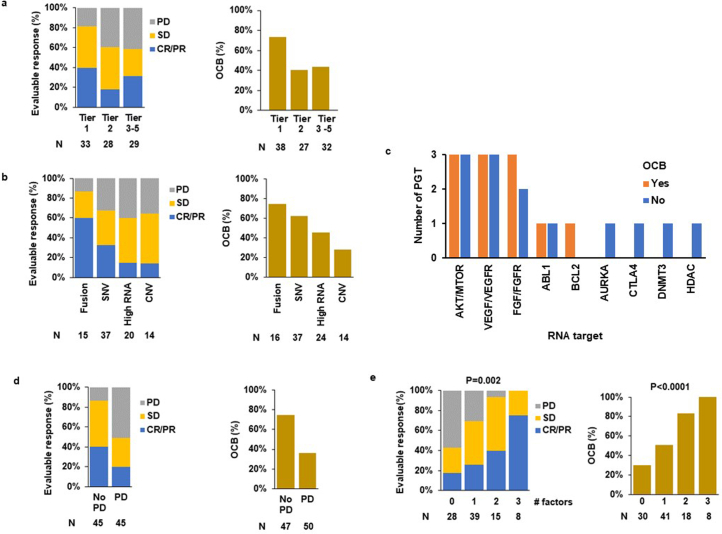
Extended Data Fig. 5. Factors influencing response to precision-guided therapy (PGT).
a, b, Evaluable response and objective clinical benefit (OCB) rate by (a) tier of PGT recommendation and (b) stratified by types of molecular aberration. c, The number of PGTs with and without OCB for each specific RNA targets or pathways. d, e, Evaluable response and OCB rate by (d) progressive disease (PD) from enrolment to the start of PGT and (e) number of favorable prognostic factors. Chi-square test is used to compare evaluable response and OCB rate between 2 groups and the actual P values are presented in Table 1. The P value shown in panel (d) is for Chi-square test for trend. CNV, copy number variation; CR, complete response; PR, partial response; PD, progressive disease; SD, stable disease; SNV, single nucleotide variant; SV, structural variant.

