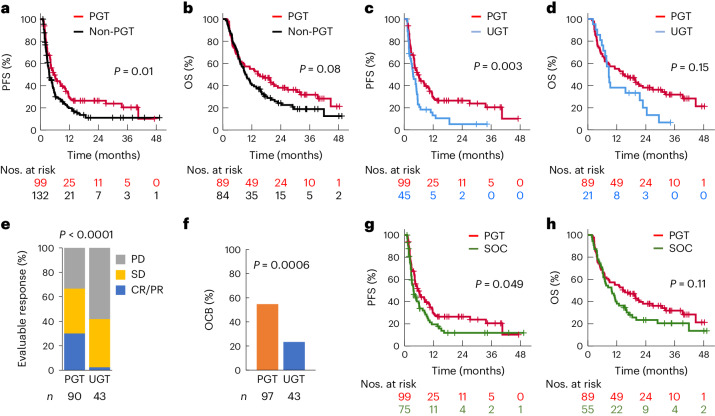
Fig. 3. Superior clinical outcome of PGT.
a,b, PFS (a) and OS (b) stratified according to PGT and non-PGT commenced at any point after MTB discussion. c,d, PFS (c) and OS (d) stratified according to PGT and UGT, that is, new therapy not molecularly guided. e, Response to PGT and UGT in patients with evaluable disease. f, OCB rate in PGT and UGT. OCB was defined as CR, PR and SD of 24 weeks’ duration or longer, and ongoing CR of 24 weeks or longer for patients who were in CR at the start of treatment. A two-sided chi-squared test was used to compare the CR and PR rate in e and OCB rate in f. g,h, PFS (g) and OS (h) stratified according to PGT and SOC. For OS comparison, a patient was categorized according to the first treatment that was initiated after MTB discussion. The Kaplan–Meier survival curves were compared using a two-sided log-rank test.

