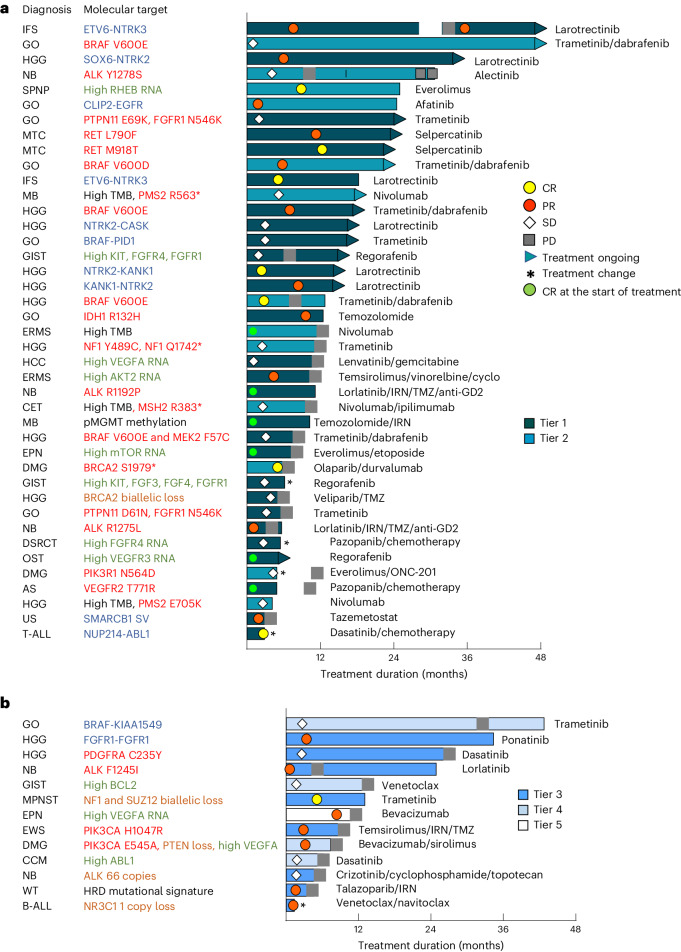
Fig. 4. PGT leads to OCB.
a,b, Swimmer plot of 53 PGTs (51 patients) leading to OCB. OCB includes CR, PR and SD for a duration of 24 weeks or longer and ongoing CR of 24 weeks or longer for patients who were in CR at the start of treatment. Forty-one PGTs with tier 1 and 2 recommendations are show in a and 12 with tier 3–5 recommendations are shown in b. The color of the bars indicates the tier of a PGT recommendation. The symbols indicate the responses and treatment status. The diagnosis and molecular targets for each patient are shown. The types of molecular aberration are denoted by different colored text. The fusion or structural variant (SV) is shown in blue, SNVs in red, high RNA expression in green, copy number variant in brown and other alterations in black. AS, angiosarcoma; B-ALL, B cell acute lymphoblastic leukemia; CCM, clear cell meningioma; CET, CNS embryonal tumor not otherwise specified; DMG, diffuse midline glioma H3K27M-altered; DSRCT, desmoplastic small round cell tumor; ERMS, embryonal rhabdomyosarcoma; GIST, gastrointestinal stromal tumor; GO, glioma other; HCC, hepatocellular carcinoma; HGG, high-grade glioma; IFS, infantile fibrosarcoma; MPNST, malignant peripheral nerve sheath tumor; MTV, medullary thyroid carcinoma; NB, neuroblastoma; SPNP, solid pseudopapillary neoplasm of the pancreas; T-ALL, T cell acute lymphoblastic leukemia; US, undifferentiated sarcoma; WT, Wilms tumor.

