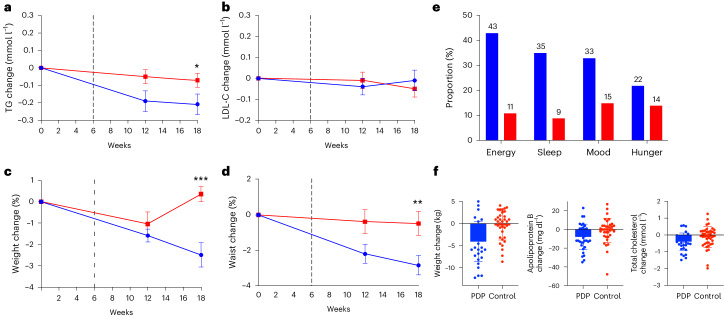
Fig. 4. Changes in primary and selected secondary outcomes during the intervention period.
a–d, Mean ± s.e.m. changes from baseline values in TG (mmol l−1) (P = 0.016) (a), LDL-C (mmol l−1) (b), weight (%) (P < 0.001) (c) and waist circumference (%) (P = 0.008) (d), in participants allocated to the PDP (blue line) (n = 177) or control (red line) (n = 172) group. Repeated measures model between groups. e, Proportion (%) of participants in the PDP and control groups with subjective improvements in energy level, sleep quality, mood, and hunger levels. f, Changes in weight (kg), apolipoprotein B (mg dl−1) and total cholesterol (mmol l−1) for highly adherent PDP (n = 35) and controls (n = 39) (mean and s.e.m. shown). *P < 0.05, **P < 0.01, ***P < 0.001.

