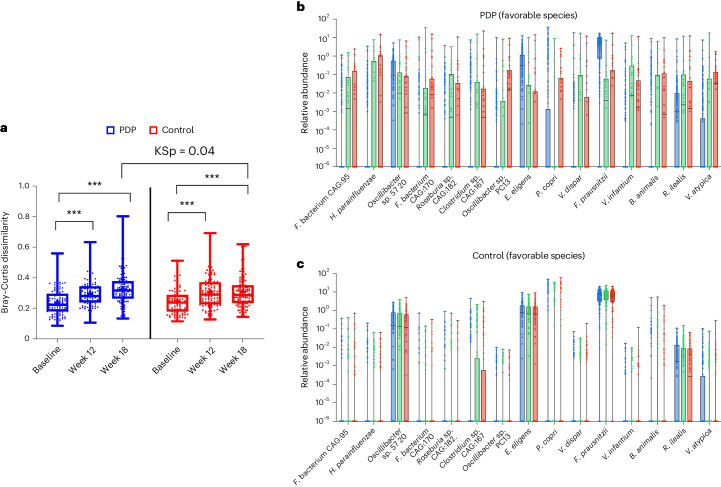
Fig. 5. Impact of dietary intervention on the gut microbiome.
a, Bray–Curtis dissimilarity at baseline, week 12 and week 18, for the control (red) (n = 118) and PDP (blue) (n = 112) groups. Data presented include the first quartile, median and third quartile. KSp between treatment groups (P = 0.04). ***P < 0.001 determined using a paired, one-sided Wilcoxon rank-sum test for within-individual change in Bray–Curtis dissimilarity. b,c, Relative abundance of favorable microbial species at baseline (blue), week 12 (green) and week 18 (red) for PDP (n = 112) (b) and control (n = 118) (c) groups (minimum to maximum shown).

