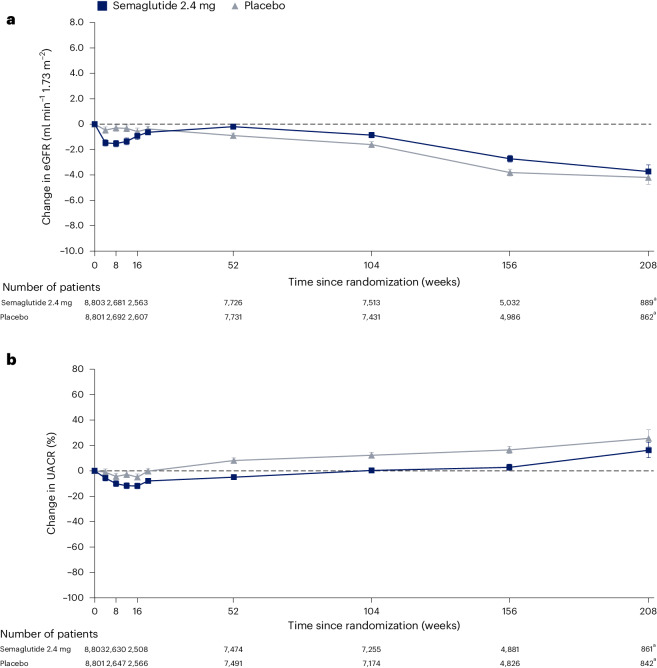
Fig. 4. Effect of semaglutide 2.4 mg on changes in eGFR and UACR over time in the overall population.
Data are estimated mean (CI) changes from the estimated baseline value in eGFR (a) and UACR (b), analyzed using an MMRM. The change in UACR was analyzed as the estimated mean ratio to baseline; for ease of interpretation; these ratios were converted to relative percentage changes from baseline using the formula (estimated ratio − 1) × 100. Numbers below the graphs are the number of patients contributing to the analysis. a Given gradual entry to the trial across the enrolment period and variable follow-up duration, data at 156 weeks and 208 weeks are sparser compared to previous timepoints.

