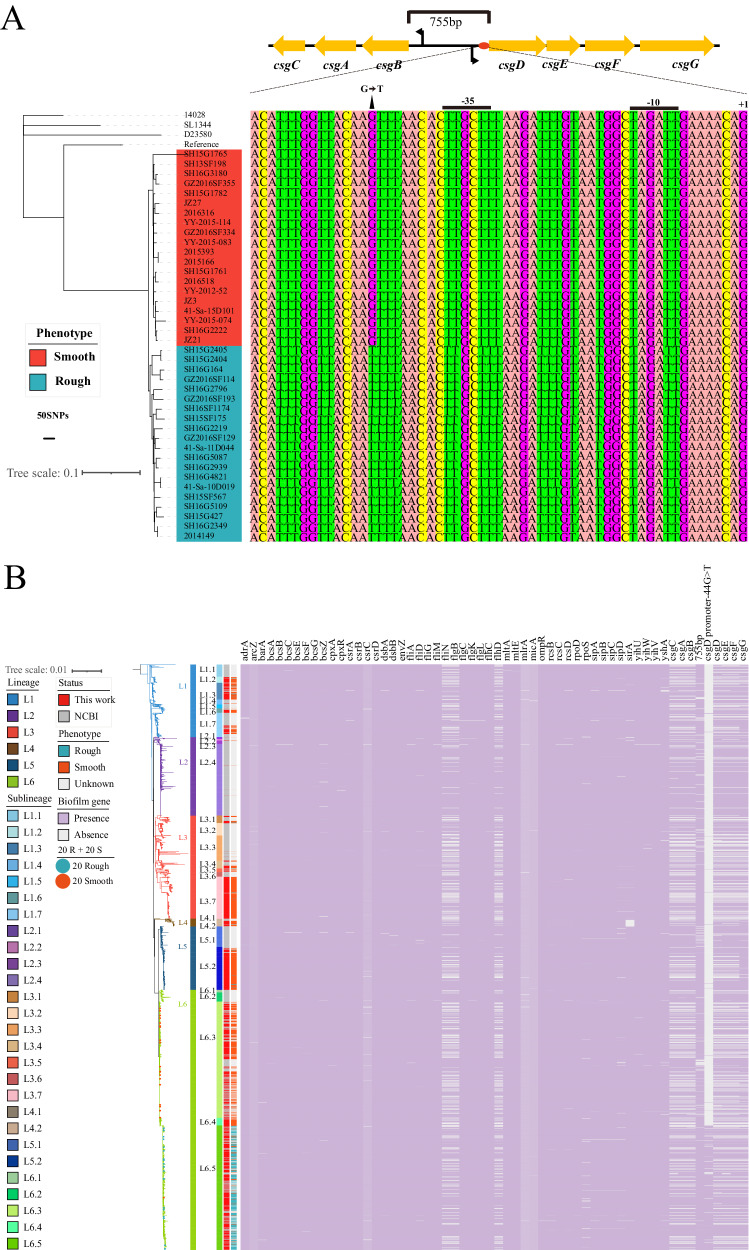
Fig. 5. Maximum likelihood phylogeny of the global S. Typhimurium isolates with a heatmap showing the distribution of biofilm formation-associated genes or mutations.
A Maximum likelihood phylogeny of the 20 rough and 20 smooth S. Typhimurium isolates with a heatmap showing the nucleotide mutations of csgBAC-csgDEFG operons. The reference genomes S. Typhimurium ATCC 14028 (GenBank accession CP043907.1), LT2 (GenBank accession NC_003197), SL1344 (GenBank accession FQ312003), and D23580 (GenBank accession FN424405) are also included. B Maximum likelihood phylogeny of the 3,951 global S. Typhimurium genomes with a heatmap showing the distribution of biofilm formation-associated genes or mutations. The presence of a biofilm gene or mutation is indicated in purple and the absence of a gene is indicated in gray. The selected 20 rough and 20 smooth S. Typhimurium isolates are indicated in blue and red, respectively. Source data are provided as a Source Data file. SNP single nucleotide polymorphism.

