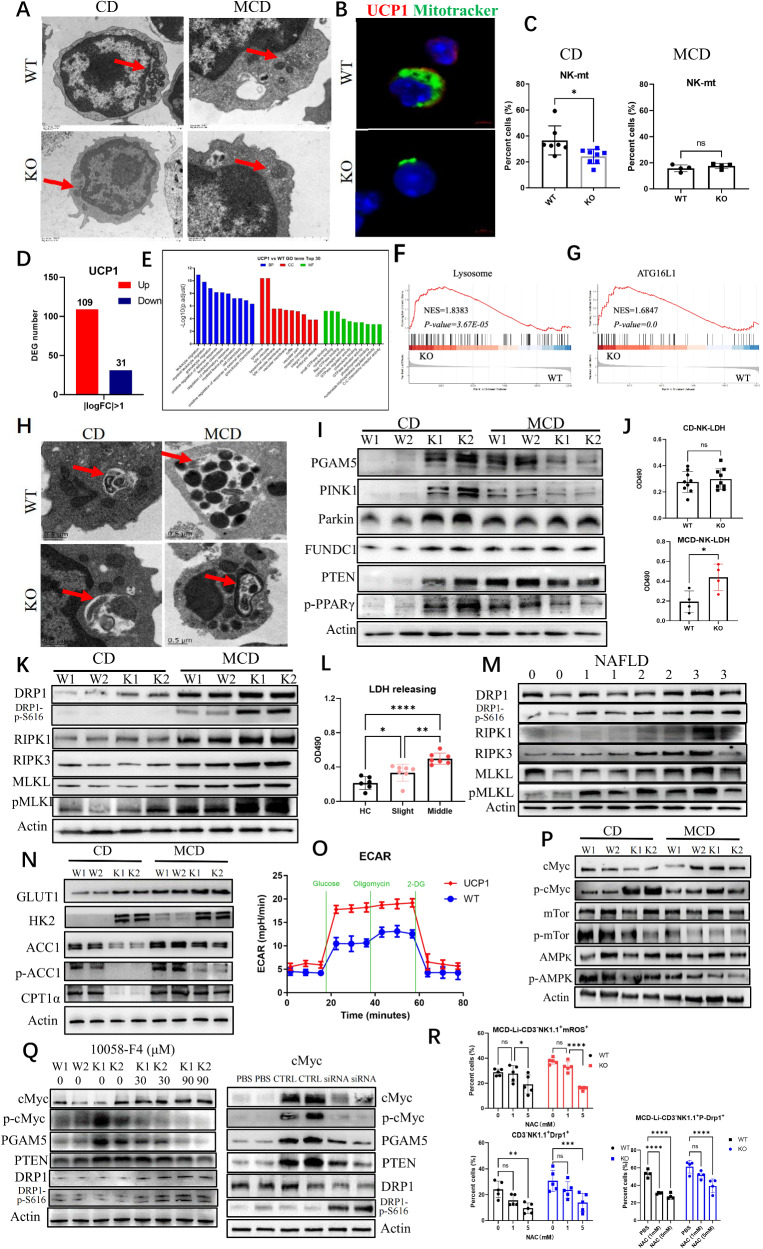
Fig. 3. Variations of mitophagy and necroptosis in UCP1−/− NK cells under high-lipid context.
A Electronic microscope of mitochondria in NK cells. B Co-staining of UCP1 and mitotracker by confocal microscope. C Mitochondrial weight of NK cells upon CD or MCD feeding. D Differential expression genes (DEGs) between NKWT and NKKO cells physiologically. E GO analysis of DEGs. Changes of lysosome (F) and ATG16L1 (G) displayed by GSEA. H Autophagic vacuoles in NK cells upon CD or MCD feeding. Variations of mitophagy molecules (I), LDH releasing (J), and necroptosis molecules (K) in MCD-treated mice. LDH releasing (L) and necroptosis molecules (M) in NAFLD patients. N Rate-limiting enzymes involved in glycolysis and oxidative phosphorylation. O Glycolysis determined by the Seahorse analysis. P Detection of p-cMyc, p-mTOR, AMPK, and p-AMPK. Q Inhibiting p-cMyc on NK cell mitophagy and necroptosis. R Variation of p-DRP1S616 by ROS depletion (N-acetylcysteine, 5 mM) in UCP1−/− NK cells of MCD-fed mice. NK cells were isolated from mouse spleen. The experiments were repeated at least twice. Ns no significance; *P < 0.05; **P < 0.01; ***P < 0.001; ****P < 0.0001.

