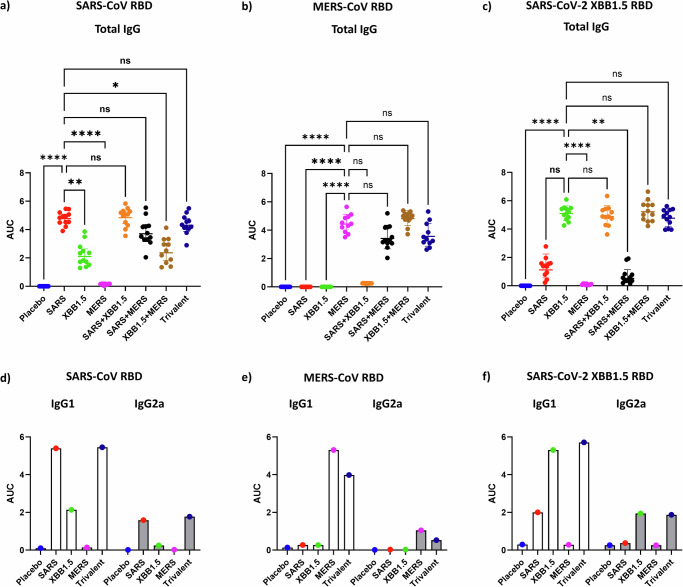
Fig. 1. Antigen-specific ELISA.
a–c Total serum IgG levels against recombinant SARS-CoV RBD, MERS-CoV RBD, and SARS-COV XBB1.5 RBD. Each panel’s X-axis represents the different experimental groups. Mice (n = 12/group) were immunized twice, 3 weeks apart, with the specified CoV RBDs formulated with Alum + CpG55.2. Serum samples were collected 14 days after the second vaccination and assessed in an ELISA against immobilized, recombinant RBD protein specified in the header of each panel. The Y-axis displays the area under the curve (AUC), derived from the ELISA data of a serum titration curve. Data presenting individual samples alongside geometric means with 95% confidence intervals. Statistical significance for each group against the matching monovalent vaccine group was determined by non-parametric Kruskal–Wallis multiple comparison test p > 0.123 (ns), p < 0.032 (*), p < 0.0021(**), p < 0.0001(****). d–f ELISA AUC of antibody isotypes IgG1 and IgG2a. Sera were pooled for each group, and the data presented is the average of duplicate independent serum dilution series.

