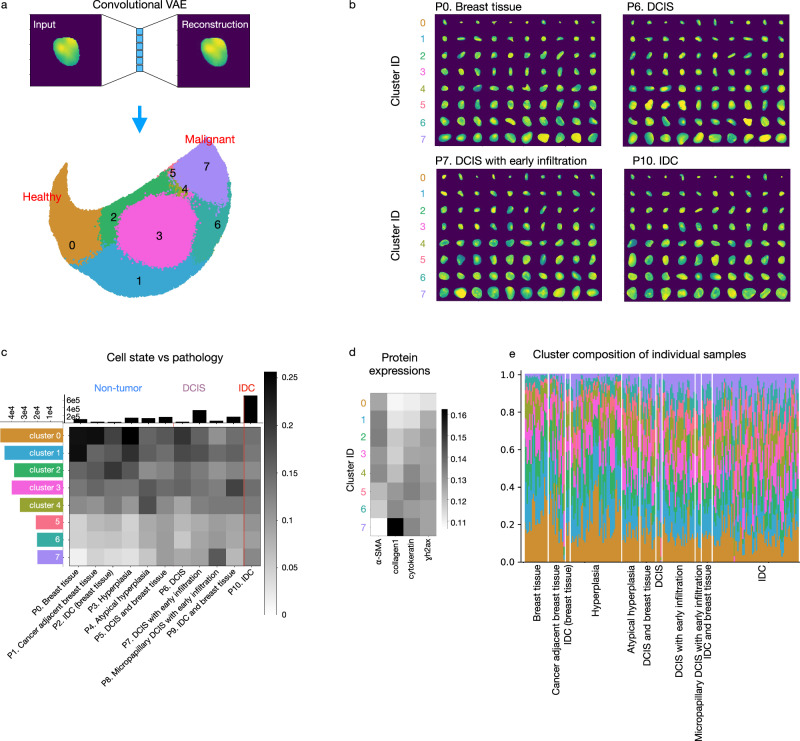
Fig. 2. Extracting and clustering single-cell chromatin image features through the use of an autoencoder framework results in the identification of morphologically distinct cell states in DCIS.
a An example of an input and reconstructed single-cell chromatin image by our convolutional variational autoencoder (VAE) framework. The latent representation of the chromatin images was clustered into eight top-level clusters. The same number of cells were selected from each of the 11 phenotypic categories for clustering (24,224 cells per stage) so that the clustering was not dominated by the cells from one particular stage. b Randomly selected examples of nuclei in each of the eight clusters in four representative phenotypes. DCIS ductal carcinoma in situ; IDC invasive ductal carcinoma. c Heatmap showing the fraction of cells in each of the eight top-level clusters in each phenotypic category organized into the three disease stages, non-tumor, ductal carcinoma in situ (DCIS), and invasive ductal carcinoma (IDC), calculated based on the cells used for clustering in (a). Columns were normalized to sum to 1. Histograms show the total number of cells in each cluster and in each phenotypic category. All cells were included for computing the histograms except for the cells in the held-out samples (“Methods”, Supplementary Fig. 12a). d The expression of each protein marker in each of the eight clusters. Columns were normalized to sum to 1. α-SMA: α-smooth muscle actin; collagen1: type 1 collagen. e Fractions of cells in each of the eight top-level clusters within each sample. The color coding of the clusters is the same as in (a) and (c). DCIS ductal carcinoma in situ; IDC invasive ductal carcinoma.

