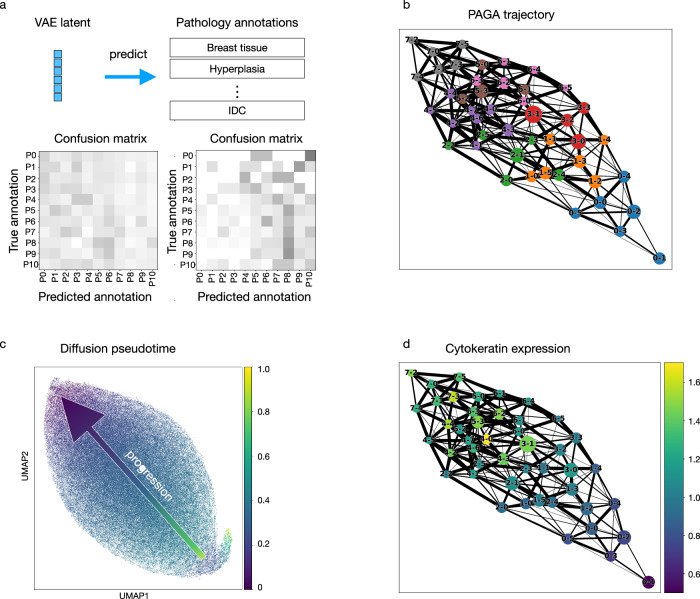
Fig. 3. All cell states are present in all disease stages, and the cell state ordering obtained in the autoencoder latent space is aligned with the enrichment of each state as a function of disease stage.
a A neural network classifier was trained to classify the phenotypic category of an input cell based on the variational autoencoder (VAE) latent representation of its chromatin image as input. A separate classifier was trained for each of the subclusters of the eight top-level clusters, with 5% of all cells held out for validation and 10% held out for testing. Confusion matrices were computed based on the cells in the test set and are shown for subcluster 0 of cluster 0 (left) and cluster 7 (right). b A network indicating the similarities between all subclusters based on the VAE latent representation was computed using the PAGA method43. Each node represents a subcluster, and its size is proportional to the number of cells in the subcluster. Subclusters within the same top-level cluster are shown in the same color. Each node is labeled by top-level cluster assignment followed by subcluster assignment. For example, 3-0 means subcluster 0 of top-level cluster 3. c Diffusion pseudotime44 as a measure of cell state similarities was computed using a randomly selected cell from subcluster 2 of cluster 7 as the root cell. The visualization was obtained using Uniform Manifold Approximation and Projection (UMAP) initialized by the subcluster positions in the PAGA graph shown in (b). d Visualization of the average cytokeratin expression on the PAGA graph for all cells stained for cytokeratin in each of the subclusters. Each dot represents a subcluster, and its size is proportional to the number of cells in the subcluster.

