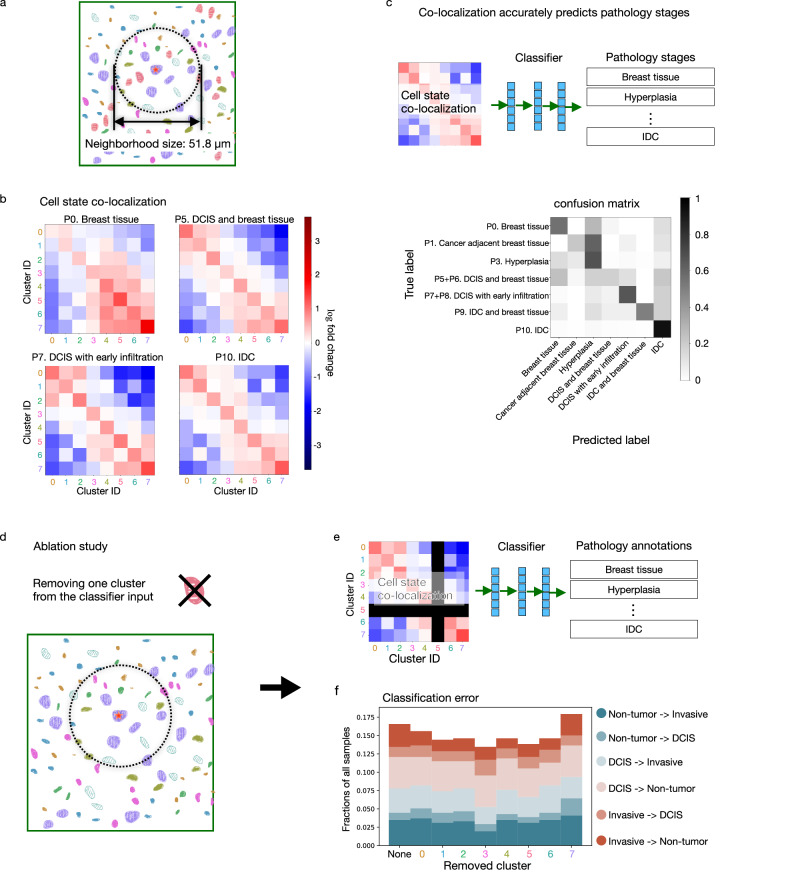
Fig. 6. Cell states co-localization pattern is predictive of disease stage and phenotypic category, and the predictiveness is dependent on the co-localization of all cell states collectively rather than a single cell state.
a Within a 25.9 µm radius around each cell, we compute a vector representing the proportions of cells in the neighborhood in each of the top-level clusters. The neighborhood size corresponds to the image patch size used to train the convolutional VAE (Supplementary Fig. 20a) that results in visually distinct clusters of image patches. b Cell state co-localization compared to a random distribution of cell states is plotted for representative phenotypic categories. The neighborhood proportion vectors of all cells within each of the eight clusters were averaged, respectively, giving rise to an 8 × 8 co-localization matrix representing for each cluster the proportion of neighboring cells within each cluster. For comparison, we randomly shuffled the cluster assignment of all cells within each sample 40,000 times and computed the resulting co-localization matrices (“Methods”). The fold-change of each entry in the observed co-localization matrix was computed with respect to the averaged random co-localization matrix. c The per-sample co-localization matrix was computed. A neural network classifier was trained to predict the phenotypic category of a sample from its co-localization matrix and the total number of cells in the sample (“Methods”). The confusion matrix shows the result of leave-one-patient-out cross-validation. d An ablation study was performed by removing cells from one of the eight clusters in the calculation of the co-localization matrix. e A neural network classifier was trained to predict the phenotypic category of a sample from the 7 × 7 co-localization matrix (where one of the clusters was ablated) and the total number of cells in the sample. f Classification error of the ablation study is plotted using leave-one-patient-out cross-validation. None means that all clusters were used as in (c) and each number indicates the ablated cluster. The classification errors are divided into 6 types and labeled as the true phenotypic category of the sample -> predicted phenotypic category of the sample. Non-tumor consists of “P0. Breast tissue”, “P1. Cancer adjacent breast tissue”, and “P3. Hyperplasia”. DCIS consists of “P5 + P6. DCIS and breast tissue” and “P7 + P8. DCIS with early infiltration”. Invasive consists of “P9. IDC and breast tissue” and “P10. IDC”.

