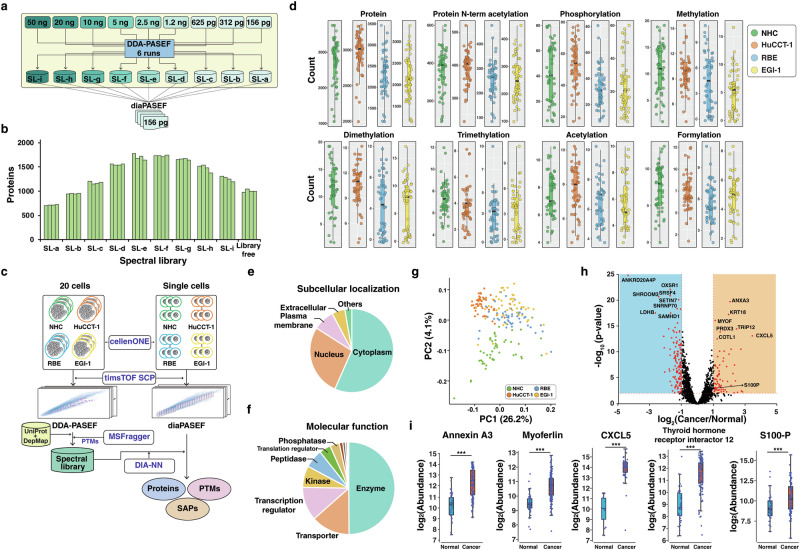
Fig. 1. Single cell proteomics of normal cholangiocytes and cholangiocarcinoma cells.
a Overall workflow for generating spectral libraries of different sizes through injection of different amounts of HeLa peptides as indicated and diaPASEF data from single cell-equivalent peptides. b Number of proteins identified from diaPASEF data of 156 pg peptides using DIA-NN. c Overall workflow for mass spectrometry-based proteome profiling of single cells. Cells were sorted using cellenONE platform and subsequent analyses were performed employing timsTOF SCP mass spectrometer. d Summary of the number of identified proteins, phosphorylated, protein N-terminal acetylated, lysine mono-, di-, trimethylated, acetylated, and formylated peptides from single cells. e Subcellular localization of identified proteins from single cells. f Molecular function of identified proteins. Proteins categorized as other molecular types (1442 proteins) were excluded from the plot of molecular function. Ingenuity pathway analysis (QIAGEN Inc., https://digitalinsights.qiagen.com/IPA) was used for categorizing subcellular localization and function of proteins. g Principal component analysis of 4197 proteins. Each circle represents data from an individual cell. h Volcano plot showing fold-changes of 3,385 proteins quantified from ≥25% samples. Differentially expressed proteins are depicted in red. i Box plots of relative abundance of representative up-regulated proteins in cancer cells (n = 150) compared to normal cells (n = 50). The line inside the box represents the median, the lower and upper edges represent the first and third quartiles and the whiskers represent 1.5 times the interquartile range. *** Adjusted p-value ≤ 0.001.

