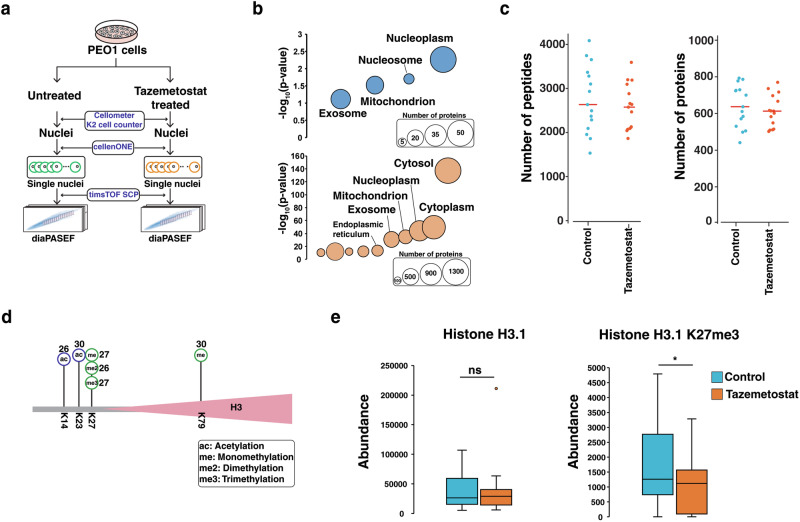
Fig. 5. Profiling of proteome and PTM of single nuclei.
a Schematic workflow for single nuclei proteome profiling from PEO1 cells. b Comparison of proteins from single cells and single nuclei. Cellular components for proteins exclusively identified in nuclei samples (132 proteins, blue circle) and proteins exclusively identified in cells (2622 proteins, orange circle) are shown. Gene ontology enrichment analysis was performed using DAVID. c The number of identified peptides and proteins across single nuclei samples from PEO1 cells in control and tazemetostat-treated conditions. d Histone H3.1 identified with PTMs of methylation, dimethylation, trimethylation, and acetylation on four lysines (K14, K23, K27 and K79). The number represents the count of detected samples out of 30 samples. e Relative abundance of histone 3.1 and trimethylation of K27 in control (n = 15) and tazemetostat-treated conditions (n = 15) shown as a boxplot with median, the lower and upper edges representing the first and third quartiles and the lower and upper whiskers represent the interquartile range× 1.5. ns: not significant; *p < 0.05.

