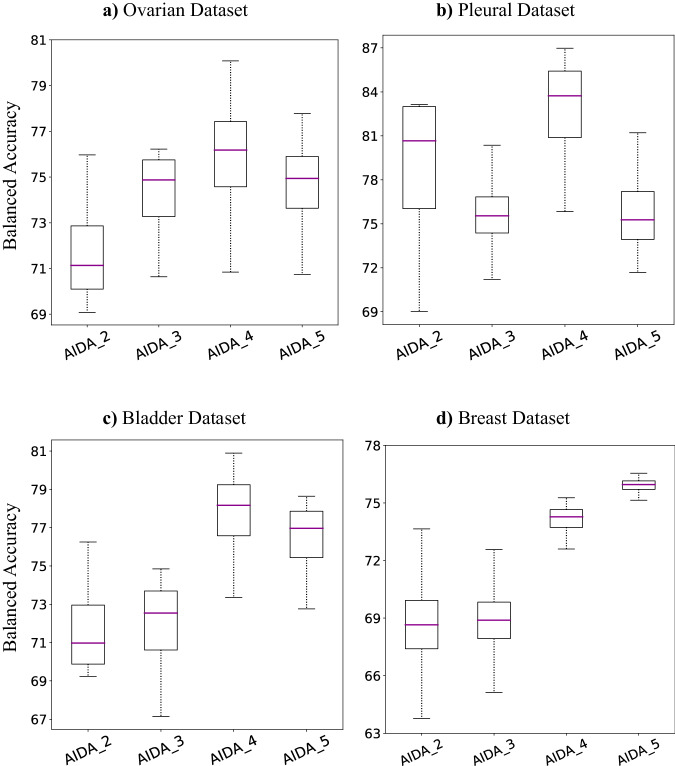
Fig. 2. AIDA with different discriminator inputs.
Comparison of the balanced accuracy achieved by using different layers as the input to the discriminator for the target domain of (a) the Ovarian Dataset, b the Pleural Dataset, c the Bladder Dataset, and (d) the Breast Dataset. In box plots, the central line represents the median, while the bottom and top edges of the box correspond to the 25th and 75th percentiles, respectively. (AIDA-X indicates using the Xth block as the input to the discriminator).

