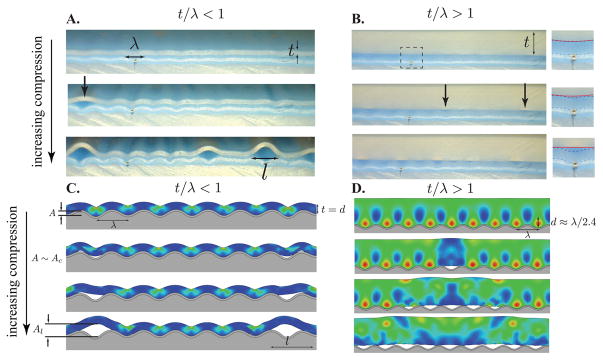
FIG. 2.
Representative images near A ~ Ac for thin-patch limit (A/C, t/λ = 0.25) and thick-patch limit (B/D t/λ = 1.25), for experimental soft silicone patches on wrinkling surfaces (top) and finite element simulations (bottom), see SI for details (SI 1.2-Silicone Patch Experiment, 1.3-FEA Simulation Methods, and 1.4-Elastic Energy Color Map). In the thin-patch limit, the patch conformally follows the wrinkling surface with strain energy distributed throughout its thickness. As Ac is approached, strain energy release through rotation off the surface into a less curved shape drives delamination (see SI videos 1 and 3). In the thick-patch limit, a boundary layer of increased strain energy exists near the wrinkled interface with a penetration length d ~ λ. As Ac is reached, the stored boundary layer energy is released driving patch detachment without much global rotation (see SI videos 2, 4, and 5). Inset in B shows zoom of patch/membrane interface: patch bottom (red line) and membrane top (blue line).

