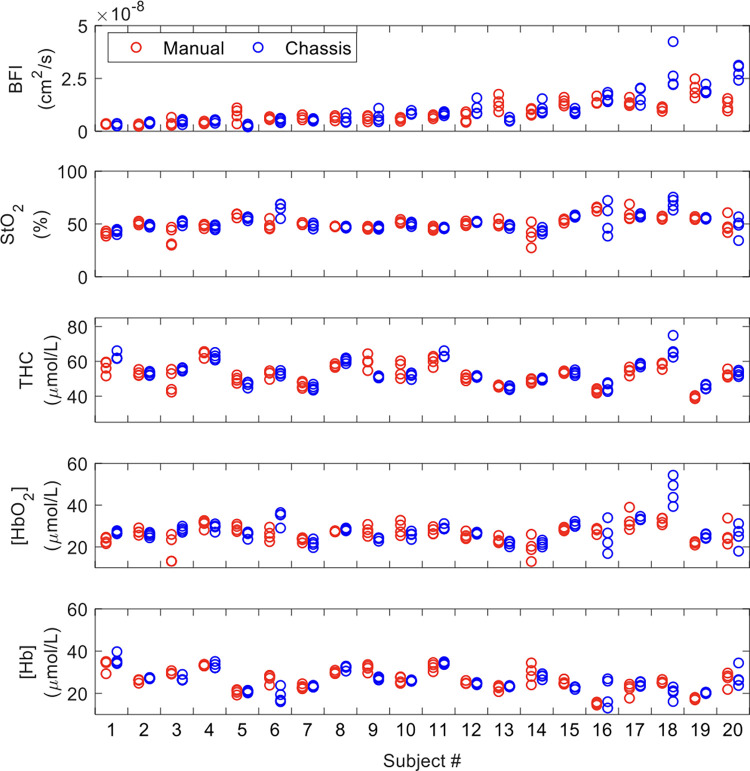
Fig 6. Measurement data.
A scatter plot of BFI, StO2, THC, [HbO2], and [Hb] measurement values (four iterations) for all subjects (plotted along the x-axis) for each method, either manual (red) or chassis (blue). Abbreviations: BFI, blood flow index; StO2, tissue oxygen saturation; THC, Total Hemoglobin Concentration; [HbO2], Concentration of Oxygenated Hemoglobin; [Hb], Concentration of Deoxygenated Hemoglobin.

