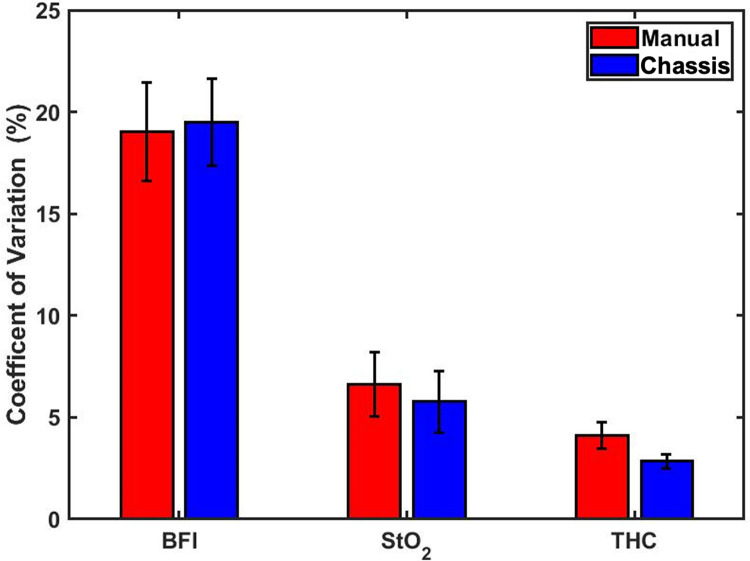
Fig 8. CV standard error of mean.
Bar Plot of the Coefficient of Variation (%) with error bars representing the standard error of the mean (SEM) of BFI, StO2, THC for each subject for all four measurements in both manual (red) and chassis (blue) methods. No statistically significant differences in CV were observed between methods. Abbreviations: BFI, blood flow index; StO2, tissue oxygen saturation; THC, Total Hemoglobin Concentration.

