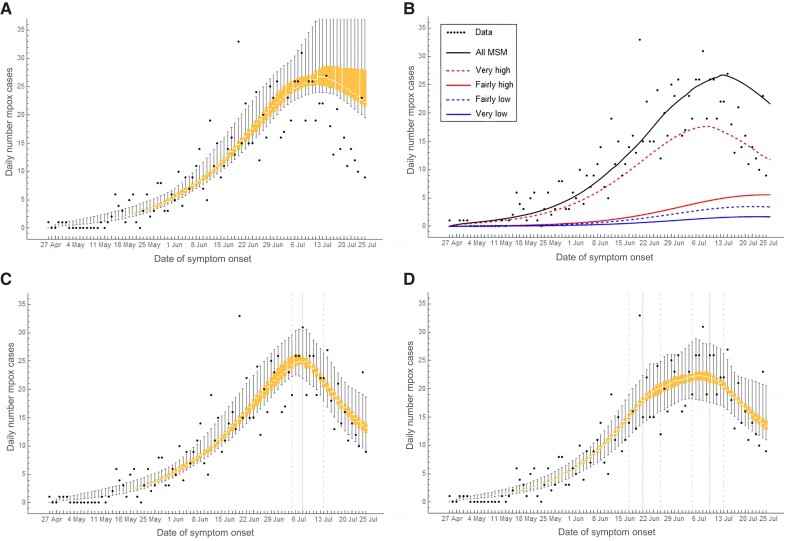
Figure 2.
The daily number of mpox cases among men who have sex with men (MSM) in the Netherlands from 27 April to 25 July 2022. Bullets show data from the national database of notifiable diseases of the Netherlands. All other results were calculated from the model. Mpox cases are shown according to date of symptom onset. The box-plots show interquartile range and min-max range of the daily numbers of mpox cases in the overall MSM population: (A) without behavioral adaptations; (C) with behavioral adaptations only in July 2022; and (D) with behavioral adaptations in June and July 2022. B, Median daily number of mpox cases in the overall MSM population (thick line) and separately in the four groups with different sexual activity level. C and D, Vertical grey lines show medians (solid lines) and 95% credible intervals (dashed lines) of the day at which the behavioral adaptations occurred, as obtained from the model fitting. Model results were calculated in a population of 250 000 MSM.

