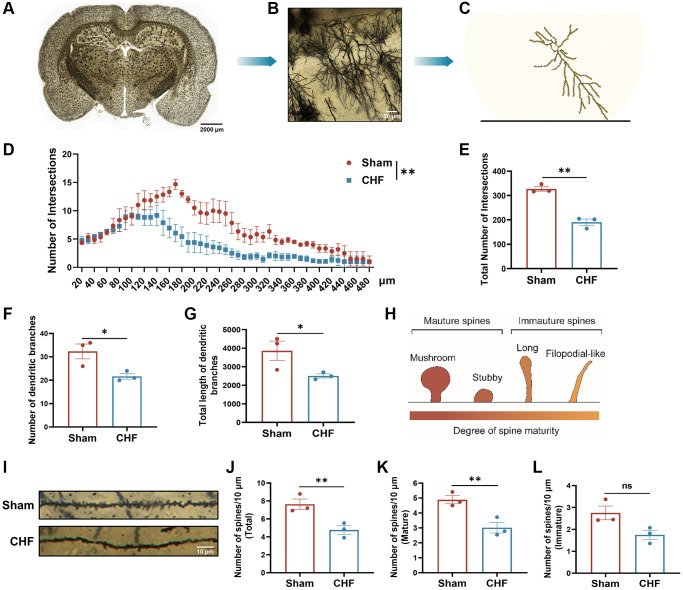
Figure 6.
CHF imperils the dendrites and dendritic spines in the hippocampus. (A–C) Examples of reconstructed neurons showing dendritic complexity via Sholl analysis. Scale bars: 50 μm. (D) Dendritic intersection distribution at increasing distance from the cell body. (E–G) Total intersection points (E), dendritic branch numbers (F), and total dendritic branch lengths (G). (H) The classical classifications of spine morphology. (I) Representative examples of dendritic spines. Scale bar: 10 μm. (J–L) Density of dendritic spines, including the number of total spines/10 μm, the number of mature spines/10 μm, the number of immature spines/10 μm. Scale bars: 10 μm. Data are presented as the Mean ± SEM; *P < 0.05, and **P < 0.01 vs. Sham; n = 3.

