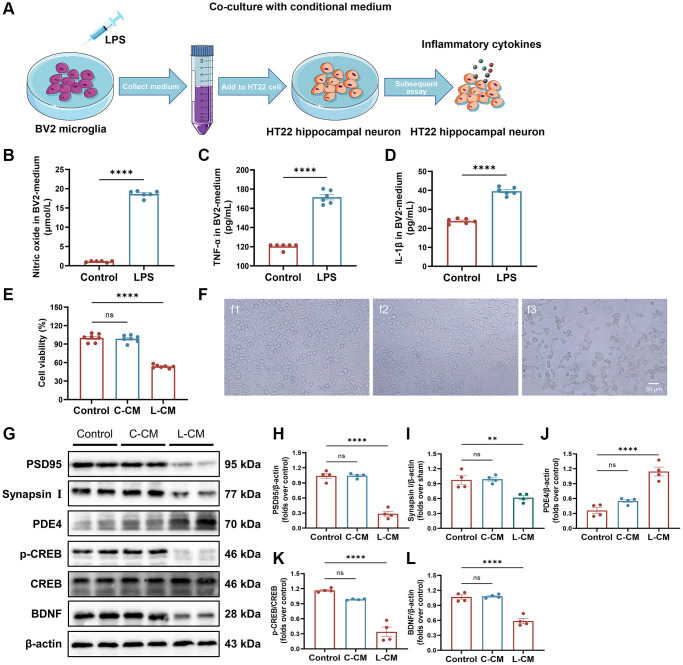
Figure 7.
BV2-induced inflammatory response damages neurons. (A) Overview of a co-culture system of BV2 microglia and HT22 hippocampal neuronal cells. (B) The level of NO in BV2 cell-free supernatant measured with an NO kit. (C, D) The levels of TNF-α and IL-1β in BV2 cell-free supernatant detected with ELISA kits. (E) HT22 cell viability when cultured by BV2 cell-free supernatant was detected by Cell Counting Kit-8 kits. (F) Representative images of HT22 cells in each group were observed by a phase-contrast microscope. (G–L) Represent Western blots (G) and quantification data of PSD95 (H), Synapsin I (I), PDE4 (J), p-CREB and CREB (K), BDNF (L). β-actin was used as a loading control. Data are presented as the Mean ± SEM; *P < 0.05, and **P < 0.01 vs. Sham; n = 4.

