Figure 8.
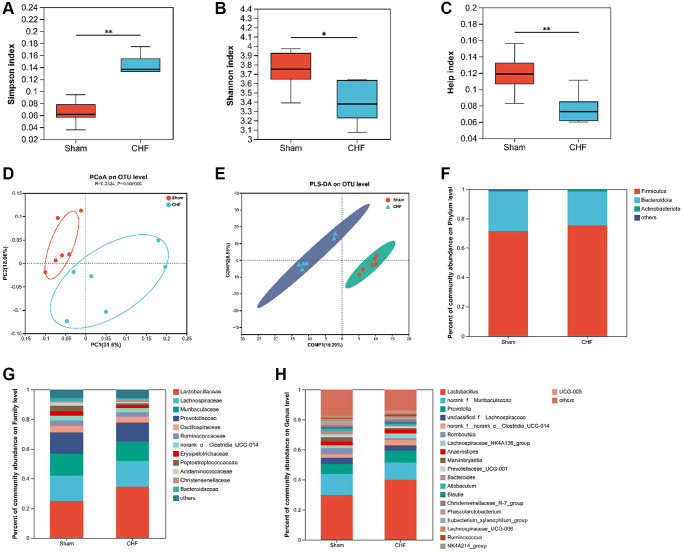
The diversity and richness of intestinal flora in CHF rats. (A–C) Decreased alpha diversity post-CHF based on Shannon (A), Simpson (B), and Heip (C) indices. (D) Beta diversity of intestinal flora differing between CHF and Sham groups. (E) PLS-DA score plots from 16S rRNA sequencing of fecal samples at OTU level. (F–H) Relative abundance of intestinal flora at the phylum level (F), family level (G), and genus level (H). Data are presented as the Mean ± SEM; *P < 0.05, and **P < 0.01 vs. Sham; n = 6.

