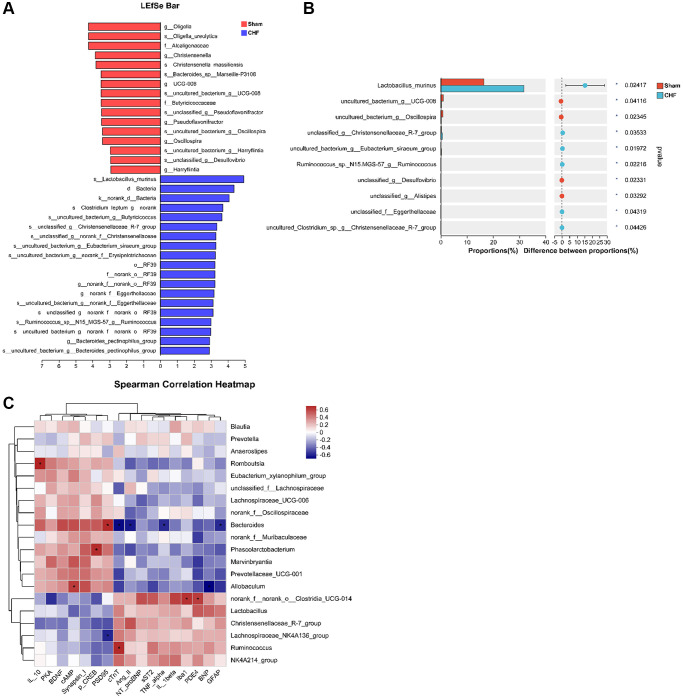
Figure 9.
Correlation between intestinal flora and inflammatory cytokines in the hippocampus. (A) The linear discriminant analysis effect size (LEfSe) analysis at species level between Sham and CHF groups. (B) The top 10 species sorted by the relative abundance alterations between Sham and CHF groups. (C) Spearman analysis correlating differential flora and biochemical indicators of cardiac function, inflammatory cytokines, BDNF and key hippocampal proteins in the hippocampus. Data are presented as the Mean ± SEM; *P < 0.05, and **P < 0.01 vs. Sham; n = 6.

