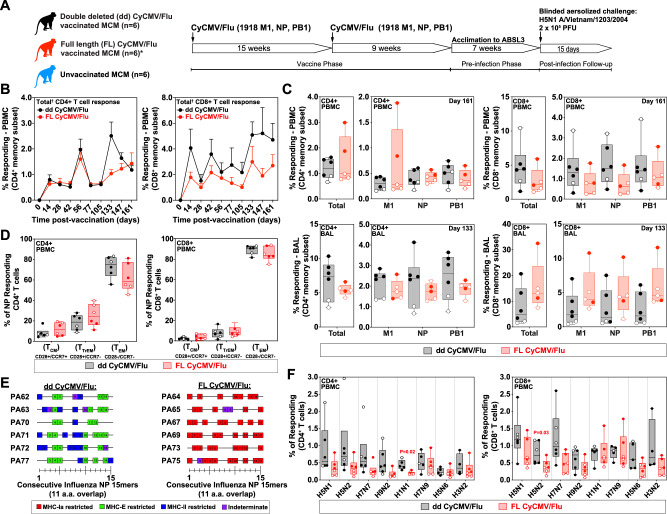
Fig. 1. Vaccine phase immunology of CyCMV/Flu-vaccinated Mauritian cynomolgus macaques (MCM).
A Study overview with major events illustrated. *Note that one FL CyCMV/Flu-vaccinated MCM died during the vaccine phase due to study-unrelated causes. B Total (summed responses against 1918 influenza M1 + NP + PB1) vaccine-induced CD4+ (left) and CD8+ (right) T cell responses during the vaccine phase in dd CyCMV/Flu-vaccinated (black) and FL CyCMV/Flu-vaccinated (red) MCM. N = 6 for each timepoint, except for n = 5 for FL CyCMV/Flu from day 133 onwards due to loss of one animal. C Magnitude of the CD4+ (left two graphs) and CD8+ (right two graphs) T cell responses in peripheral blood (top row) and bronchoalveolar lavages (BAL, bottom row) against all antigens summed or individual antigens at the final timepoint prior to H5N1 challenge in dd CyCMV/Flu-vaccinated (black) and FL CyCMV/Flu-vaccinated (red) MCM. Open circles denote MCM that succumbed to challenge while closed circles denote those that survived. N = 6 for dd CyCMV/Flu and n = 5 for FL CyCMV/Flu. D Memory phenotype of NP transgene-specific CD4+ (left) and CD8+ (right) T cells in the PBMC of the ddCyCMV/Flu-vaccinated (black) and FL CyCMV/Flu-vaccinated (red) MCM. Open circles denote MCM that succumbed to challenge while closed circles denote those that survived. PBMC for this assay were pooled from days 28, 56, 161, and 168 post vaccination. N = 6 for each group. E MHC restriction of CD8 + T cell responses to 1918 influenza NP. Boxes depict NP 15mers recognized by CD8 + T cells in a given animal with colors indicating MHC-restriction of each response as indicated. PBMC for this assay were pooled from days 105, 119, 133, 147, 161, and 168 post vaccination. F Recognition of the various inactivated whole influenza isolates indicated on the x axis by CD4+ (left) or CD8+ (right) T cells in the PBMC of dd CyCMV/Flu-vaccinated (black) and FL CyCMV/Flu-vaccinated (red) MCM following overnight co-culture. Open circles denote MCM that succumbed to challenge while closed circles denote those that survived. N = 6 for each group. PBMC for this assay were pooled from days 105, 119, 133, 147, 161, and 168 post vaccination. Box plots in B–D, F show jittered points and a box from first to third quartiles and a line at the median, with whiskers extending to the farthest data point within 1.5x IQR above and below the box. Source data are provided as a Source Data file. Figure 1A created with BioRender.com released under a Creative Commons Attribution-Noncommercial-NoDerivs 4.0 International license.

