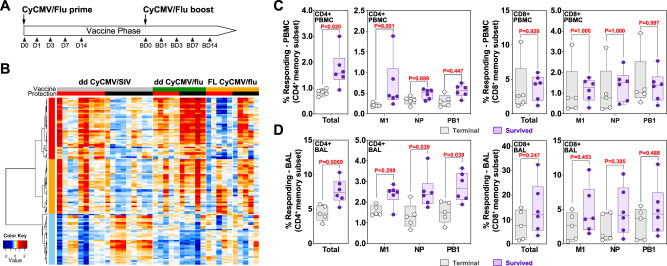
Fig. 3. Correlates of protection in CyCMV/Flu-vaccinated MCM protected from lethal H5N1 influenza challenge.
A Experimental timeline of sampling for whole blood transcriptomic analysis during the ddCyCMV/Flu vaccine phase. BD=boost day. B Time series heatmap of the dd CyCMV/SIV IL−15 protection signature genes (left, under dd CyCMV/SIV) compared to dd CyCMV/Flu (middle) and FL CyCMV/Flu-vaccinated MCM (right). Protected animals are denoted with a red heading bar versus unprotected animals in black in the protection row. Plotted are log2 fold change values of the 122 leading edge genes across the vaccination time series (Days 0, 1, 3, and 7 post prime and boost immunizations). Red and blue denote up- and down-regulated log fold change to D0, respectively. The dd CyCMV/SIV data are from Malouli et al. 28. C Magnitude of the CD4+ (left two graphs) and CD8+ (right two graphs) T cell responses in peripheral blood against all CyCMV-vectored influenza antigens summed (total, left) or individual antigens (right) at the final timepoint prior to H5N1 challenge in MCM that died (grey open circles) versus those that survived (lavender closed circles) after H5N1 challenge. N = 6 for animals that survived and n = 5 for animals that died. PBMC for this assay were from day 161 post vaccination. D Magnitude of the CD4+ (left two graphs) and CD8+ (right two graphs) T cell responses in the lung (BAL) against all CyCMV-vectored influenza antigens summed (total, left) or individual antigens (right) at the final timepoint prior to H5N1 challenge in MCM that died (grey open circles) versus those that survived (lavender closed circles) after H5N1 challenge. N = 6 for animals that survived and n = 5 for animals that died. BAL cells for this assay were from day 133 post vaccination. Box plots in C and D show jittered points and a box from first to third quartiles and a line at the median, with whiskers extending to the farthest data point within 1.5x IQR above and below the box. In C and D for total T cell responses a 2-sided T test was used, while for M1, NP, and PB1 comparisons pairwise repeated measures ANOVA with 2-sided Tukey adjustment was used. Source data are provided as a Source Data file.

